Join Our Telegram channel to stay up to date on breaking news coverage
BCH Price Prediction – February 2
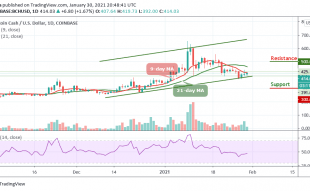
The Bitcoin Cash shows an amazing bullish trend as it rises from today’s low of $411 to currently trading above $432.
BCH/USD Market
Key Levels:
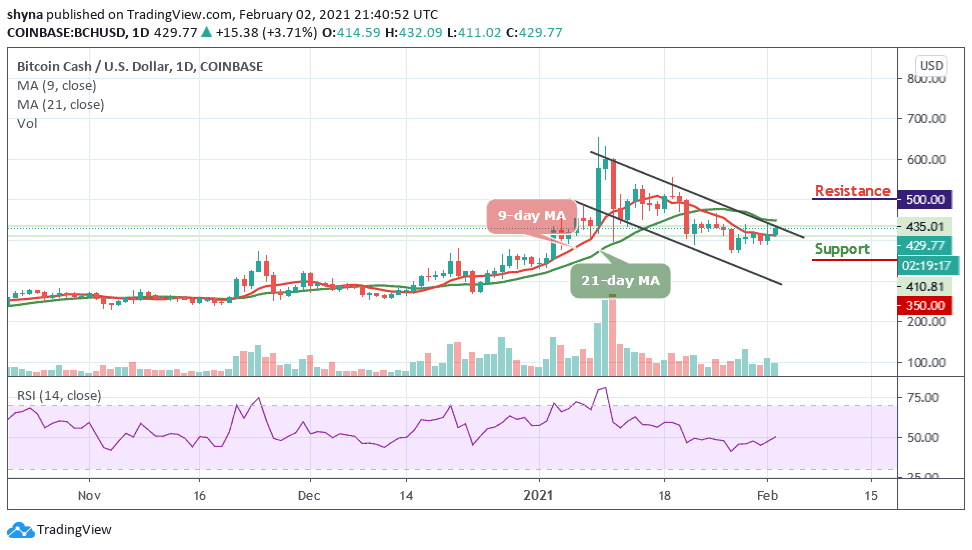
Resistance levels: $500, $550, $600
Support levels: $350, $300, $250
BCH/USD is seen pushing the price above the 9-day moving average at $429.77 at the time of writing. The Bitcoin Cash is also seen focusing on the bullish momentum waiting for the coin to break above the channel. More so, the coin gains over 3.7% since the beginning of the day as it is using $370 support as a jumping-off ground to develop the upside momentum, which is now gaining traction.
What is the Next Direction for Bitcoin Cash (BCH)
On the upside, if BCH/USD finally moves and stays above the moving averages, the price may likely break through the resistance level of $450. Meanwhile, the technical indicator shows that the bulls are getting ready for action especially when the up-trending RSI (14) begins. Any further bullish movement above the channel may pave the way to the resistance levels of $500, $550, and 600.
On other hand, if the price falls below the 9 moving average, the market may be compelled either to a range-bound or begin a downward movement. Meanwhile, this could serve as a major blow for the market sentiments as traders could interpret it as a sign of underlying weakness. The next important support comes at $370, which may be followed by $350, $300, and $270 support levels.
Against Bitcoin, the market is seen trading below the 9-day and 21-day moving averages as the coin hovers around 1197 SAT because the technical indicator RSI (14) is likely to cross below the 40-level and this could find the nearest support level at 1000 SAT and below.
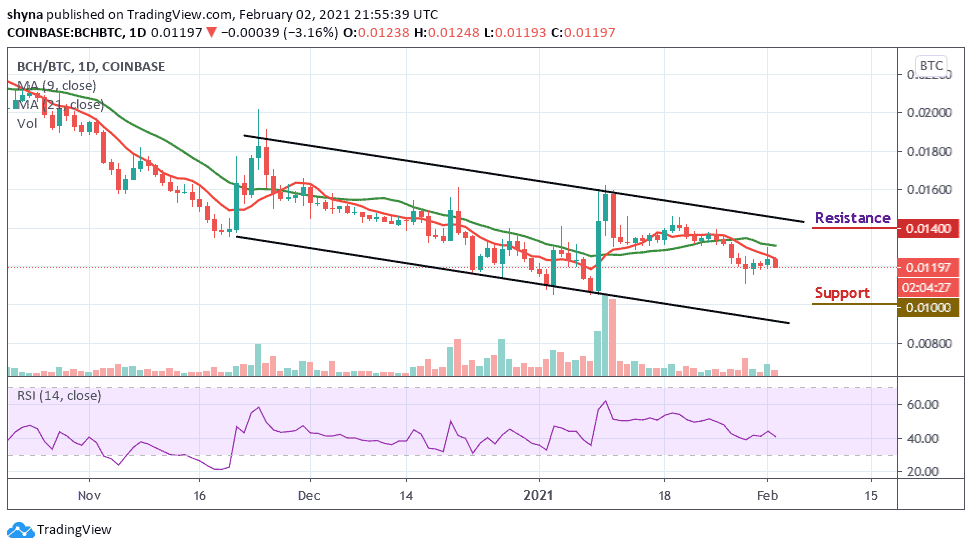
However, peradventure the buyers pushes the price above the moving averages, the market price may likely begin a bullish movement, while rising further may take the coin to the resistance level of 1400 SAT and below. Meanwhile, the 9-day MA is moving conveniently below the 21-day MA, suggesting a more bearish move.
Join Our Telegram channel to stay up to date on breaking news coverage