Join Our Telegram channel to stay up to date on breaking news coverage
BCH Price Prediction – January 12
The technical indicator reveals that the BCH price may continue the downward momentum.
BCH/USD Market
Key Levels:
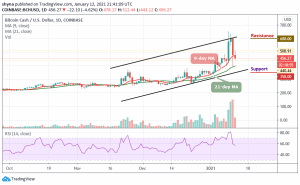
Resistance levels: $600, $650, $700
Support levels: $350, $300, $250

A few days ago, BCH/USD peaked at $654, and at the moment, it has been following a downward trend within the channel. Meanwhile, for the price not staying above $600 ruins the long-term technical picture of the coin. Bitcoin cash will have to hold the current market value in other to guide against the further downward pressure and the closest support expects the coin at $400. Once it is eliminated, the downside may likely grow, with the next goal supporting $350, $300, and $250 levels.
What to Expect from Bitcoin Cash (BCH)
The Bitcoin cash is hovering at $456.27 but yet to break below the 21-day moving average after broken the 9-day moving average. On the upside, a sustained move above $500 may ease the initial downside pressure and create momentum for the bulls with the focus to move the market to the next resistance levels of $600, $650, and $700 respectively.
At the moment, the RSI (14) nosedives below 60-level, which indicates that the downward momentum may likely continue. Furthermore, the support formed between $450 and $400 provided air-tight protection which may allow the buyers to concentrate on stirring action to the north.
BCH/BTC Market: Continues to Follow the Downtrend
When compares with Bitcoin, the daily chart reveals that bears continue to show some commitment above the 9-day and 21-day moving averages. Meanwhile, following the recent negative signs may cause the trend to continue to go down if the sellers pump more pressure into the market.
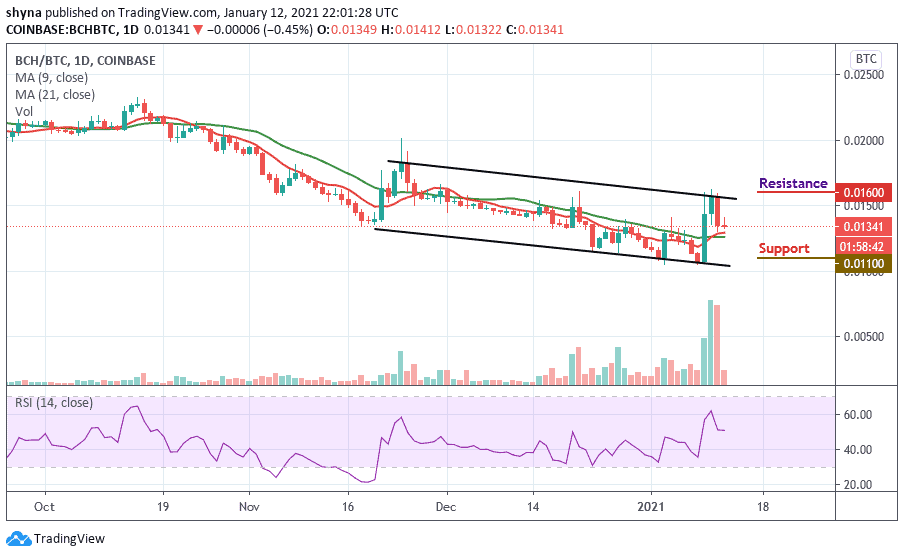
Moreover, as the RSI (14) signal line nosedives below 55-level, if the buyers can hold the support at 1341 SAT, the market price may begin an upward movement, while pushing further may take it to the resistance level of 1600 SAT and above but a retest could lower the price to the supports of 1100 SAT and below.
Join Our Telegram channel to stay up to date on breaking news coverage