Join Our Telegram channel to stay up to date on breaking news coverage
BCH Price Prediction – December 19
Bitcoin Cash (BCH) is on the positive side as the bulls push its value to 2.75% higher.
BCH/USD Market
Key Levels:
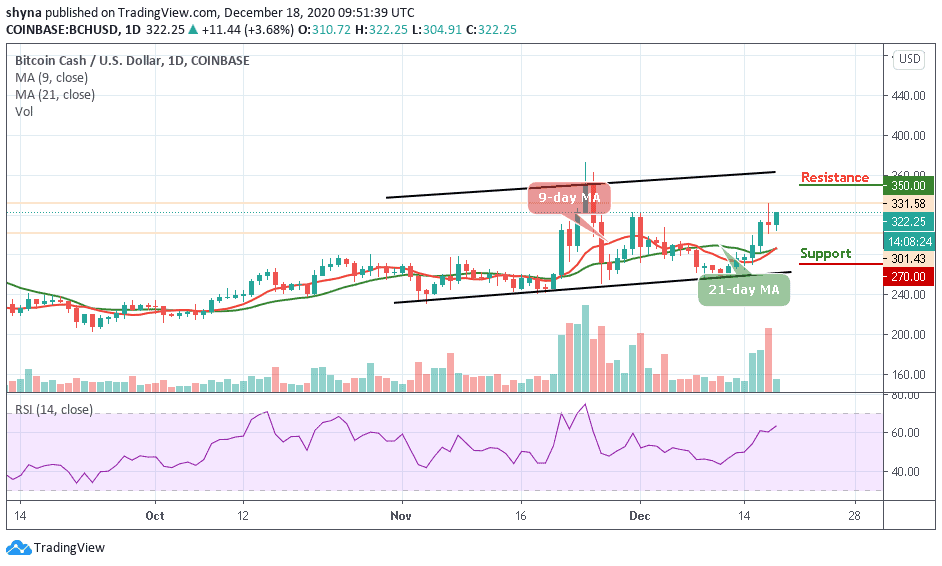
Resistance levels: $360, $370, $380
Support levels: $280, $270, $260
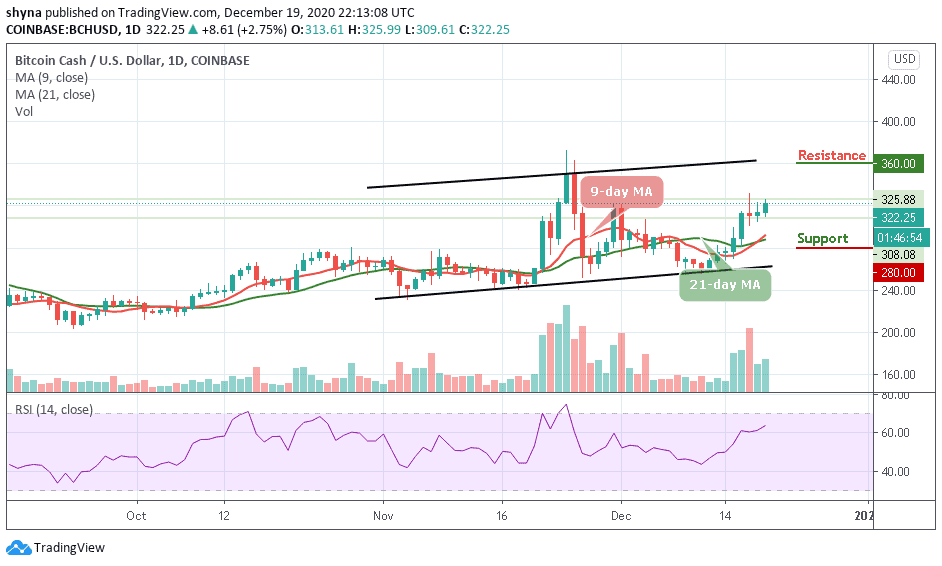
BCH/USD is currently pushing the market price above the crucial resistance level of $320. The coin is trading above the 9-day and 21-day moving averages and touches the daily high of $325.99. The coin is now focusing on the bullish momentum after a sustainable break above an important technical level. More so, the coin is gaining around 2.75% since the beginning of the day as it is using $300 support as a jumping-off ground to develop the upside momentum, which is now gaining traction.
What to Expect from Bitcoin Cash (BCH)
On the upside, if BCH/USD moves toward the upper boundary of the channel, the price may break through the resistance level of $350 respectively. Meanwhile, the technical indicator shows that the bulls are ready for action especially when the up-trending RSI (14) is moving above the 60-level. Any further bullish movement above the channel may pave the way for the resistance levels of $360, $370, and 380.
Nevertheless, if the price falls below the $300 level, the market may be compelled either to a range-bound or begin a downward movement. Meanwhile, the bearish movement may likely serve as a major blow for the market sentiments as traders could interpret it as a sign of underlying weakness. The next important support may come at $300, which may be followed by $280, $270, and $260 support levels.
When compares with Bitcoin, the daily chart reveals that the bears are focusing on the downtrend. However, the recent negative signs reveal that the trend may continue to go down if the sellers continue to put more pressure into the market.
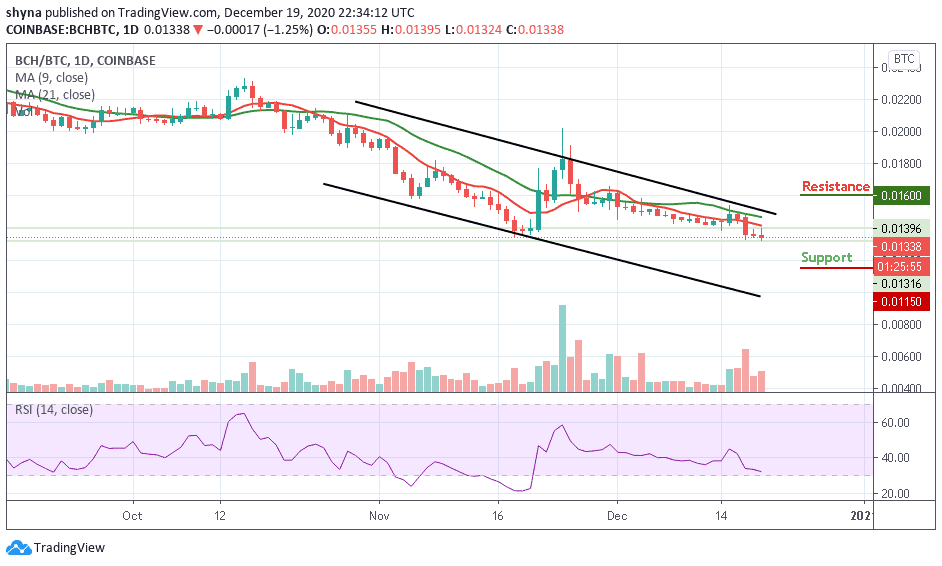
However, as the RSI (14) signal line is ready to fall into the oversold zone, if the buyers can hold the support of 0.135 BTC, the market price may likely continue an upward movement, pushing further can take it to the resistance level of 0.016 BTC and above but a retest could lower the price towards the lower boundary of the channel, which may likely create another low at 0.011 BTC and below.
Join Our Telegram channel to stay up to date on breaking news coverage