Join Our Telegram channel to stay up to date on breaking news coverage
BCH Price Analysis – October 5
It is likely for the Bitcoin Cash to continue with the downward momentum as revealed by the technical indicator.
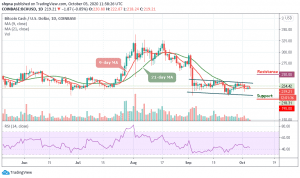
BCH/USD Market
Key Levels:
Resistance levels: $250, $260, $270
Support levels: $195, $185, $175

Looking at the daily chart, BCH/USD peaked at $222 in the early hours of today, since then, the market price has been following a downward trend within the channel. However, for the price not staying above $230 at the beginning of this month ruins the long-term technical picture of the coin. Meanwhile, BCH/USD will have to hold this level to guide against any further downward pressure and the closest support expects the coin at $200. Once it is eliminated, the downside may likely grow, with the next goal supporting $195, $185, and $175 levels.
Where is BCH Price Going Next?
At the moment, the Bitcoin cash is hovering at $219.21 but yet to break above the 9-day and 21-day moving averages. On the upside, a sustained move above $225 may ease the initial downside pressure and create momentum for the bulls with the focus to move the market to the next resistance levels of $250, $260, and $270 respectively. At the moment, RSI (14) may nosedives below 45-level, suggesting that the downward momentum may likely play out.
Furthermore, we realize that the recent consolidation within the descending channel may be necessary for the bullish action. More so, the support formed between $212 and $216 provided air-tight protection allowing the buyers to concentrate on stirring action to the north.
When compares with Bitcoin, towards the end of last month, the bulls showed a little commitment to BCH trading. Presently, the market price is following the downward trend and it may continue the current movement if the sellers put more pressure on the bulls.
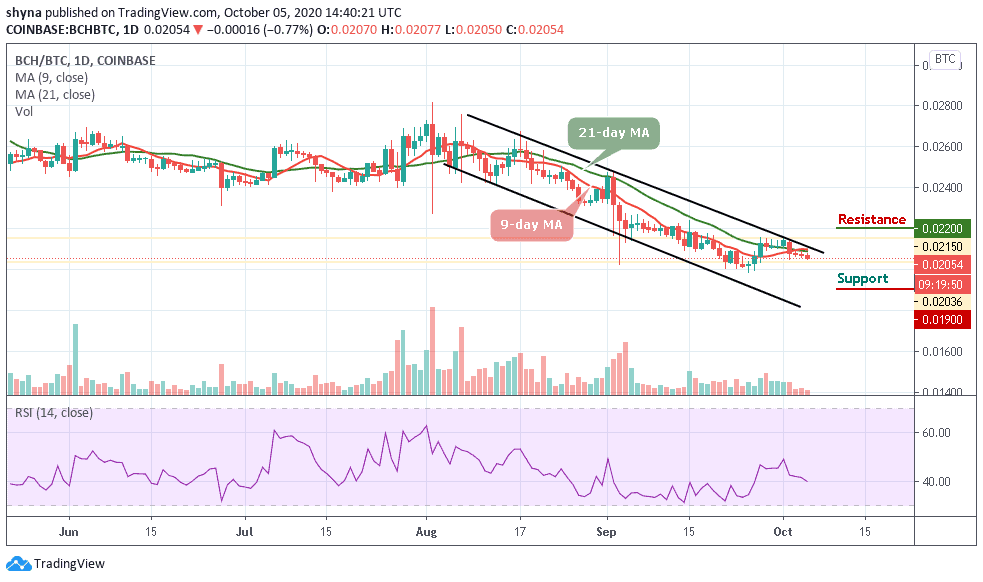
However, if the buyers make an attempt to break above the 9-day and 21-day moving average and possibly cross the upper boundary of the channel; the market price may likely reach the resistance level of 0.022 BTC and above. As it stands now, any further bearish movement could lower the price to the support level of 0.019 BTC and below as the RSI (14) indicator prepares to cross below the 40-level to give more bearish signals.
Join Our Telegram channel to stay up to date on breaking news coverage