
Join Our Telegram channel to stay up to date on breaking news coverage
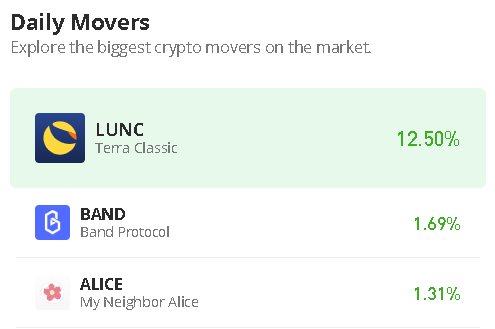
The Band Protocol price prediction reveals that BAND is moving bullishly with a gain of 2.08%, as the coin prepares to cross above the 21-day moving average.
Band Protocol Prediction Statistics Data:
- Band Protocol price now – $1.53
- Band Protocol market cap – $191.8 million
- Band Protocol circulating supply – 125.7 million
- Band Protocol total supply – 134.5 million
- Band Protocol Coinmarketcap ranking – #149
BAND/USD Market
Key Levels:
Resistance levels: $2.00, $2.20, $2.40
Support levels: $1.00, $0.80, $0.60
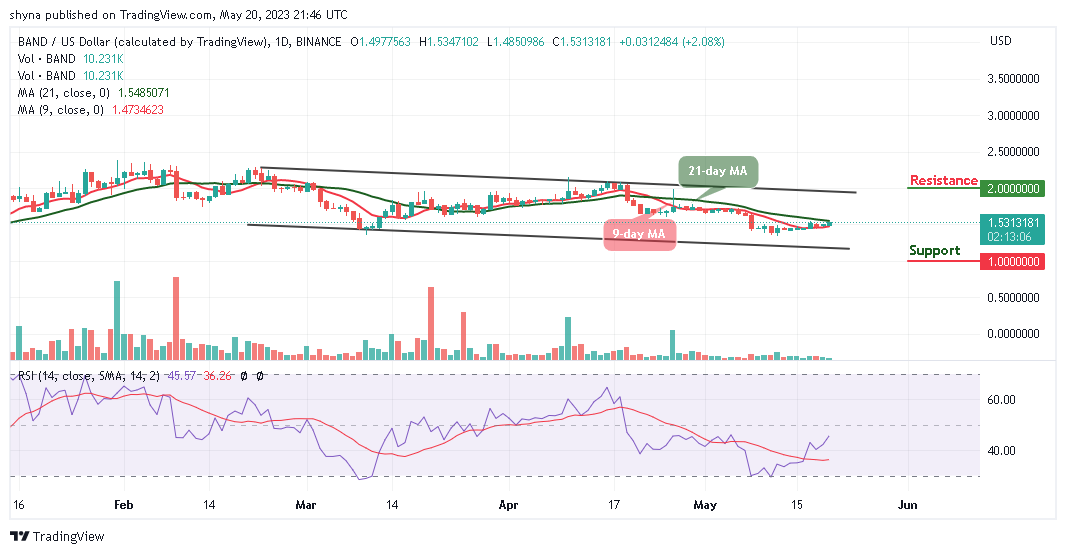
BAND/USD is trying to cross above the 21-day moving average as the coin prepares for the upside with a gain of 2.08%. According to the daily chart, the candle formation may continue to respect the upward movement, but sliding below the lower boundary of the channel might position the market price towards the south while the closest support level could be located around the $1.40 level.
Band Protocol Price Prediction: Band Protocol Price May Spike to the Upside
The Band Protocol price is heading to the upside as an increase above the 21-day moving average could trigger intense buying to the resistance levels of $2.00, $2.20, and $2.40. On the contrary, the Band Protocol price may likely hold the current market value at $1.53 before heading to the nearest support level of $1.40. Therefore, if the Band Protocol price drops below this support level, it may likely hit the closest support at $1.30.
Meanwhile, the critical support after this could be located around the $1.00, $0.80, and $0.60 levels if the selling volume keeps increasing. However, the technical indicator Relative Strength Index (14) reveals that the market may gain more upwards if the signal line crosses above the 50-level.
Against Bitcoin, the Band Protocol price is hovering above the 9-day and 21-day moving averages. Meanwhile, if the coin continues to rise, the nearest resistance level could be at 700 SAT and above as the technical indicator Relative Strength Index (14) moves tic cross above the 50-level.
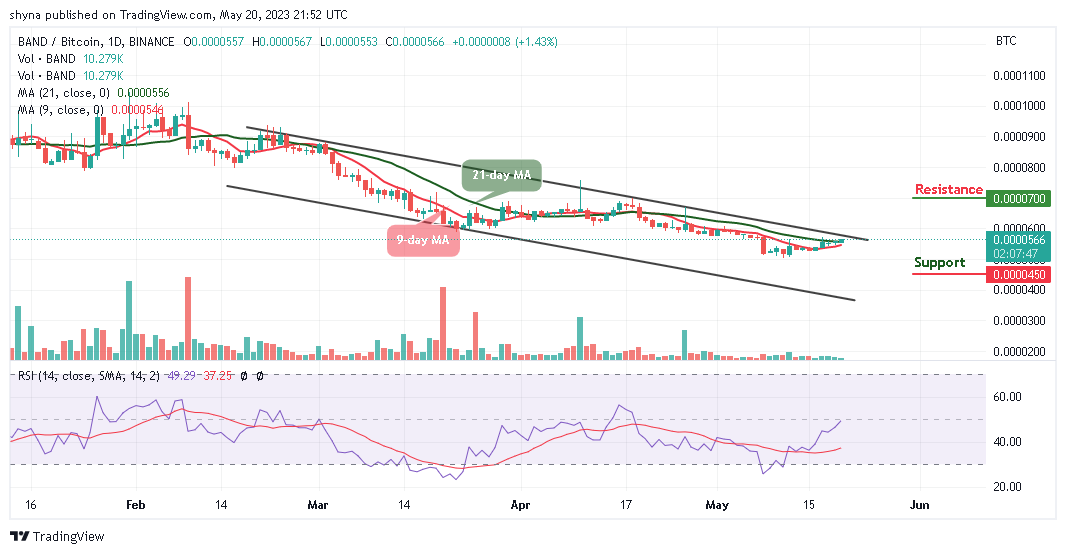
Looking at the upside; if the coin slides below the 9-day moving average and heads toward the lower boundary of the channel, the nearest support level could be located at 500 SAT. Therefore, if the price falls further to create a new low, the support could be found at 450 SAT and below. Meanwhile, if the 9-day MA crosses above the 21-day MA, this could mean that the market may trade bullishly.
Band Protocol Alternatives
On the daily chart, the Band Protocol price is feeling the impact of a tailwind, and this has resulted in a sudden spike in its price action. Therefore, if buyers could maintain their bullishness, the Band Protocol price action may break more upsides. On that note, AiDoge is a crypto startup, meaning it requires funding from investors to achieve its goals. This is why AiDoge has just launched its much-anticipated presale campaign. This enables growth investors to buy AI at a discounted price before the projects are listed on crypto exchanges. The token aims to cash in on a growing market as almost $12 million has been raised in the presale.
Join Our Telegram channel to stay up to date on breaking news coverage