Join Our Telegram channel to stay up to date on breaking news coverage
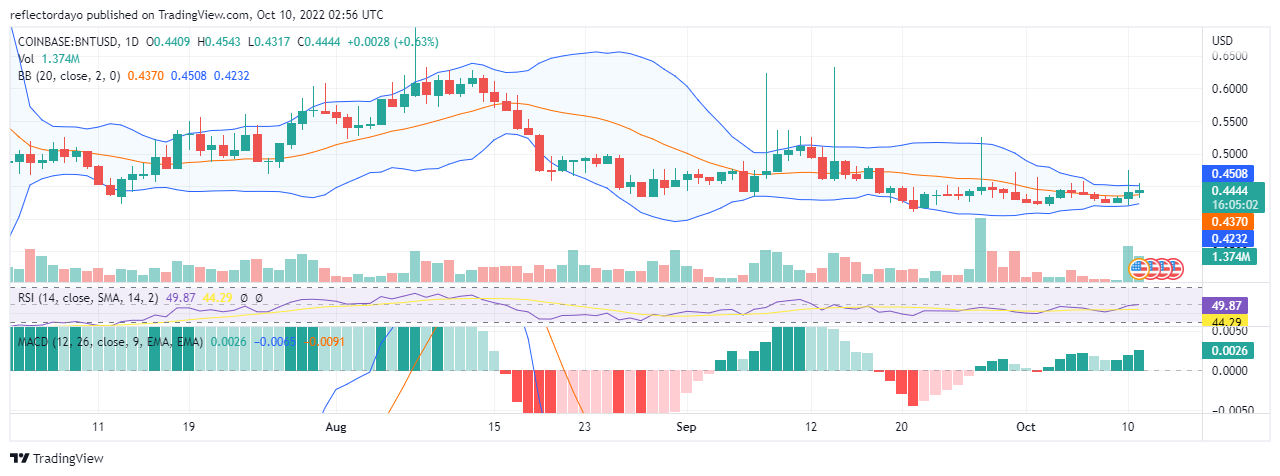
Bancor’s bullish trend, from July, was cut short at the price resistance level of $0.6104, on the 8th of August. This happened when the price (unlike any other bullish candlestick that has appeared before on the chart) skyrocketed with very strong momentum; reaching almost to $0.700 price level. The bullish market movement triggered strong selling pressure. As a result of this, the bulls lost all the price levels that they have gained and the price levels returned to $0.6104. After this, the pressure of the two forces matched. This resulted in a price consolidation that lasted for 7 days. On the 15th of August, the market began moving in a bearish way. The market took its base around the $0.4242 support level. It then finds it difficult to break away since the 28th of August.
Bancor Market Price Statistic:
- BNT/USD price now: $0.4455
- BNT/USD market cap: $89,238,464
- BNT/USD circulating supply: 198.86 Million
- BNT/USD total supply: 198,857,636
- BNT/USD coin market ranking: #252
Key Levels
- Resistance: $ 0.4500, $0.5000 $0.5500
- Support: $0.4000, $0.3500, $0.3000
Your capital is at risk
Bancor Market Price Analysis: The Indicators’ Point of View
From the 20th of August to the 5th of September the bands of the Bollinger indicator expanded very wide due to the rough pull and push of the price in the market. As the bands begin to contrast, the market broke out in a bullish way on the 8th of September and the 14th of September. But, each of these bullish breakouts was followed by bearish moves in the same days. The selling pressure is very responsive to buying pressure and this is why the consolidation continues. The RSI line and the signal line have been moving along around the midpoint of the indicator for quite some time. This indication supports the long-term sideways-ranging market. But since Friday the 7th of October, the Bollinger band began to contrast. This means there is about to be a price breakout.
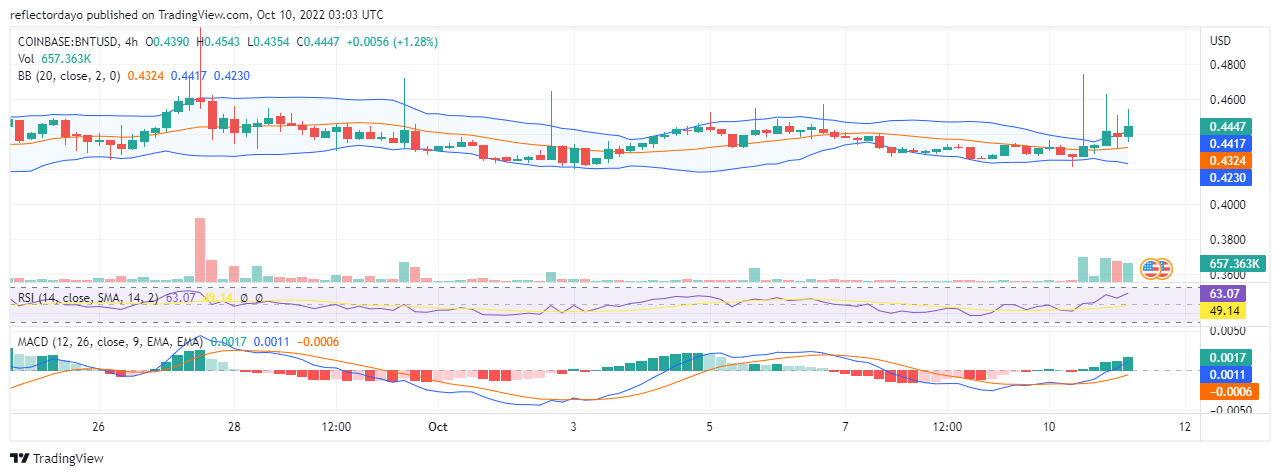
Bancor (BNT/USD) 4-Hour Chart Outlook
In the last 4-hours of yesterday’s session, the price rose very high before the sellers cut the price short as the selling pressure is responsive to buying pressure in this market. This bearish market move spilt into the first four hours of today. The bulls failed to fully recover the price before the session was over. In the second session, the bulls began to have the upper hand.
Join Our Telegram channel to stay up to date on breaking news coverage