Join Our Telegram channel to stay up to date on breaking news coverage
The Axie Infinity price prediction shows that AXS is heading toward the upper boundary of the channel after a rapid retracement.
Axie Infinity Prediction Statistics Data:
- Axie Infinity price now – $4.54
- Axie Infinity market cap – $635.3 million
- Axie Infinity circulating supply – 141.3 million
- Axie Infinity total supply – 270 million
- Axie Infinity Coinmarketcap ranking – #52
AXS/USD Market
Key Levels:
Resistance levels: $5.30, $5.40, $5.50
Support levels: $3.90, $3.80, $3.70

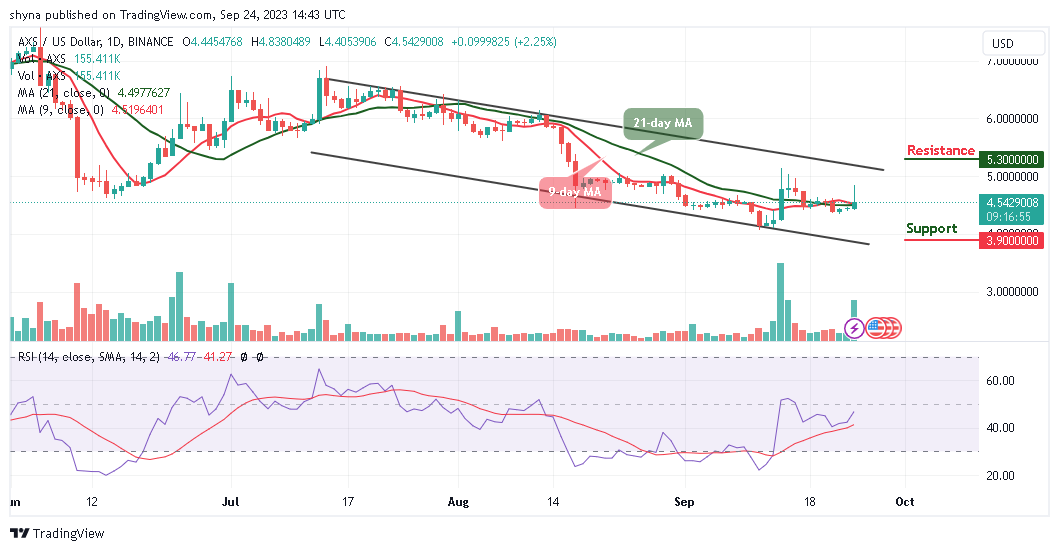
AXS/USD is currently in a recovery phase, surpassing the initial opening price of $4.44. There’s a strong likelihood that it will continue its ascent and potentially reach or exceed the $5.0 level shortly. This surge in price is being driven by bullish sentiment, with Axie Infinity trading above the 9-day and 21-day moving averages.
Axie Infinity Price Prediction: AXS Could Reach $5.0 Level
The Axie Infinity price seems poised to breach the upper boundary of the channel. Should AXS/USD successfully break through this channel, it could encounter a significant resistance level at $5.20. A successful breakthrough here could pave the way for further gains, which could hit the resistance levels of $5.30, $5.40, and even $5.50 in the next bullish phase.
According to the technical indicators, it’s noteworthy that the Relative Strength Index (RSI) with a period of 14 is on the verge of crossing above the 50-level. This suggests a potential upward breakout. However, a dip below the 9-day and 21-day moving averages could test the support level at $4.30. The next substantial support level lies at the lower boundary of the channel, where bullish traders are likely to make a strong stand. Nevertheless, any bearish movement could bring the price toward support levels at $3.90, $3.80, and $3.70.
AXS/BTC Experiences Bullish Potential
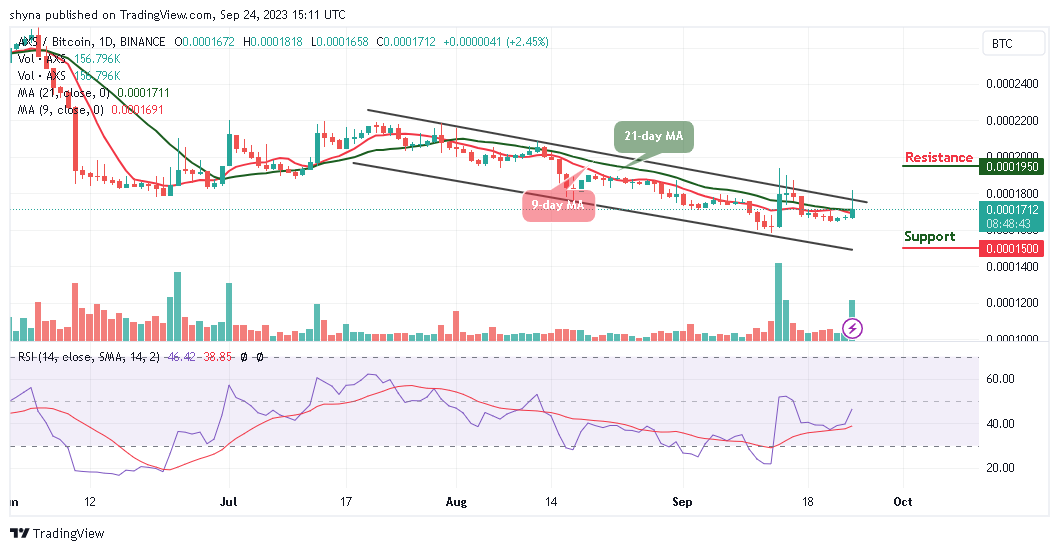
Against Bitcoin, the Axie Infinity price is exhibiting bullish momentum, trading above the 9-day and 21-day moving averages. It has been consistently hovering near the upper boundary of the channel. The Relative Strength Index (14) may likely cross above the 50-level, confirming the ongoing bullish trend.

However, if the price manages to breach the upper boundary of the channel, it may prompt bullish traders to target the resistance level at 1900 SAT. Further staying above this level could propel the price toward the resistance level of 1950 SAT resistance and above. Conversely, a dip below the 9-day and 21-day moving averages might lead to a support level around 1500 SAT and below.
Alternatives to Axie Infinity
The Axie Infinity is trading within the 9-day and 21-day moving averages after touching the daily high at the $4.83 resistance level. At the time of writing, AXS/USD is changing hands at $4.54, heading toward the upper boundary of the channel. However, with latest the recovery, the digital asset is likely to cross above the channel to increase the bullish movement.
However, in the ongoing Wall Street Memes ($WSM) token presale, around $1.4m has been raised in the past 24 hours. Therefore, the token will be sold out within hours! And will be listed on top exchanges. So BUY now!
CoinCodex - Our Recommended Crypto Research Platform
- Live Cryptocurrency Prices for Over 20,000 Coins
- Crypto Price Analysis with Popular Technical Indicators
- Crypto Price Predictions with Short and Long-Term Charts
- Historical Crypto Market Data Dating to 2010
- Crypto Portfolio, Profit Calculator, and Other Investment Tools
Join Our Telegram channel to stay up to date on breaking news coverage


