Join Our Telegram channel to stay up to date on breaking news coverage
Axie Infinity (AXS) Price Prediction – November 5
There had been so many depressions in the AXS/USD trade operations down to around a deep lower-trading zone of $8.20 that has now given back a change of direction that shows the crypto economy makes significant ups to recover some lost buying momentum. Price is trading around the $10.63 value line at 9.69 percent positives.
AXS/USD Market
Key Levels:
Resistance levels: $13, $14, $15
Support levels: $8.50, $7, $6.50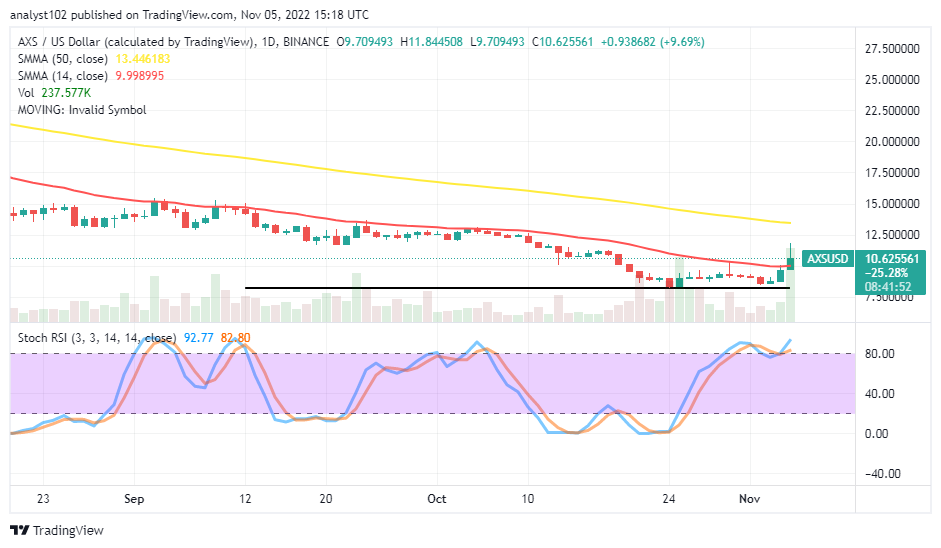
AXS/USD – Daily Chart
The AXS/USD daily chart reveals the crypto market makes significant ups as it breaks through the trend line of the smaller SMA at $9.9990. The horizontal line’s point is observed at $8.20, serving as the baseline for the current upward motions. The 50-day SMA indicator is at $13.4462, above the 14-day SMA indicator. The Stochastic Oscillators have been tightly consolidating over the 80 range for a long now. They also crossed their lines in the northern direction with range values of 82.80 and 92.77.
Has the $8.20 value line become a reliable basis for the AXS/USD market?
The $8.20 value line will serve as a test platform for any future market activity upswings for the AXS/USD pair, as the price makes significant ups above the buy signal side of the smaller SMA. As a result, the 14-day SMA would be instrumental in ascertaining the pushing pace of bulls in this crypto economy. The price must resist any potential appearance of a bearish candlestick around the $9.9990 value line to maintain the upward trend positively.
On the downside of the technical analysis, the AXS/USD market short-position placers would have to suspend execution of sell orders if the buying momentum is to hold over a long time above the 14-day SMA trend line. The market may push for a touch near the trend line of the 50-day SMA indicator before resuming a declining move afterward. Sellers are to use shorter time frames, such as one hour or four hours, to determine whether an overbought trading scenario corresponds to the daily chart and when to place a shorting position order.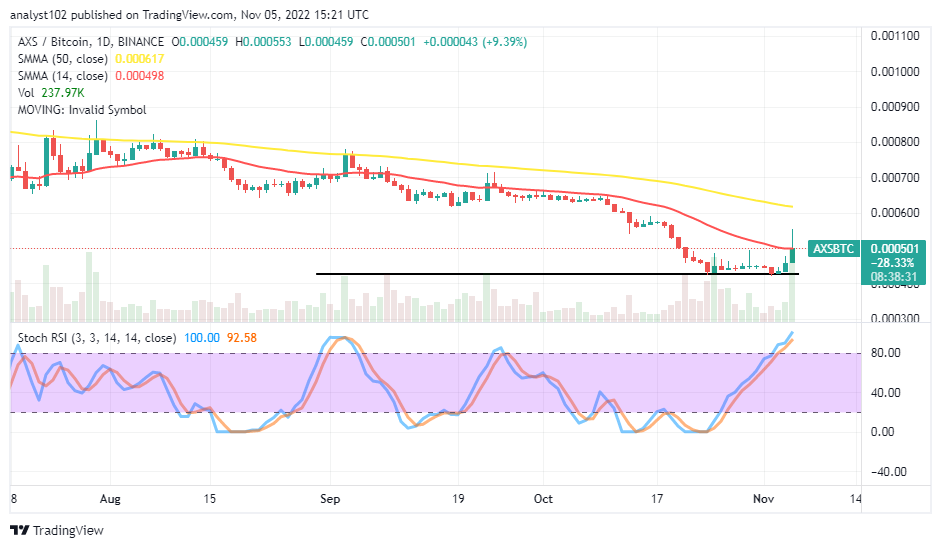
AXS.BTC Price Analysis
In comparison, Axie Infinity makes significant ups against the trending catalyst of Bitcoin after finding support below the SMA trend lines. The horizontal line drew around the baseline to ascertain the spot. The 14-day SMA indicator is underneath the 50-day SMA indicator. The Stochastic Oscillators have maintained perfect slant-moving posture from the oversold region into the overbought region, maintaining 92.58 and 100 range values. That connotes the following upswings the base crypto will make are liable to encounter quick reverses at high points against the counter crypto.
Dash 2 Trade Tokens Are Now a Good Deal in Price
The D2T Trade presale is still affordable and is selling out quickly. The platform has already received more than $5 million in funding for additional development.
Related
Join Our Telegram channel to stay up to date on breaking news coverage