
Join Our Telegram channel to stay up to date on breaking news coverage
AVAX/USD has been trending down until it reached the support level of $18.5305. It was at this point it changes its direction; trying to reach up to a higher price level. Looking at today and yesterday’s (that is 30th and 29th) price actions, the candlesticks shows increase in the buying pressure. As the market opened, yesterday, sellers pushed the price further lower until buyers regain enough strength to push the price halfway to the bearish opening price of the 28th of August. The bullish move continue and the current price is now $20.2618
Terra Classic Market Price Statistic:
- AVAX/USD price now: $ 20.2618
- AVAX/USD market cap: $ 5,760,574,546
- AVAX/USD circulating supply: 285,073,096.33
- AVAX/USD total supply: 404,229,626
- AVAX/USD coin market ranking: #16
Key Levels
- Resistance: $20.7435, $22.9340, $24.2320
- Support: $18.3910, $16.8498, $14.8215
Your capital is at risk
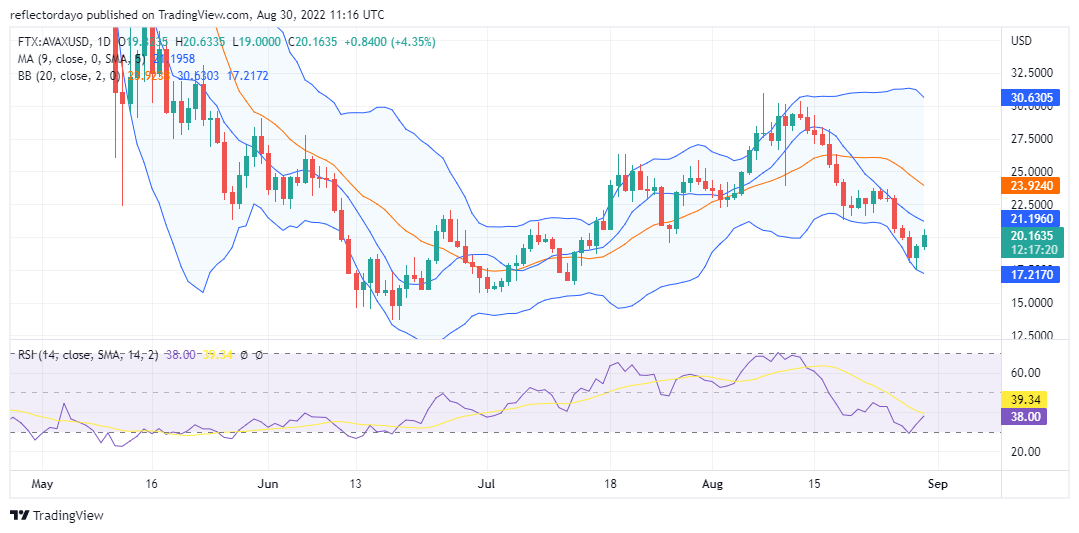
Avalanche Market Price Analysis: The Indicators Point of View
When the price reached close to the lower band of the Bollinger indicator, there is the probability that the market will rebound to find higher price levels. It also can mean the beginning of an upward trend. In the Relative Strength Index indicator, RSI line came to settle in the downtrend area on the 19th of August. The Line touched the threshold of the oversold area and then faces towards an upward position. Currently, the RSI signal line and the RSI line are moving in the downtrend zone of the indicator. And they are about to cross each other. Once the two line crosses in the lower zone of the indicator, the uptrend is confirmed. Another thing to lookout for in order to confirm the uptrend is the price actions and the 9-day moving average. The price action have to cross to the upperside of the moving average.
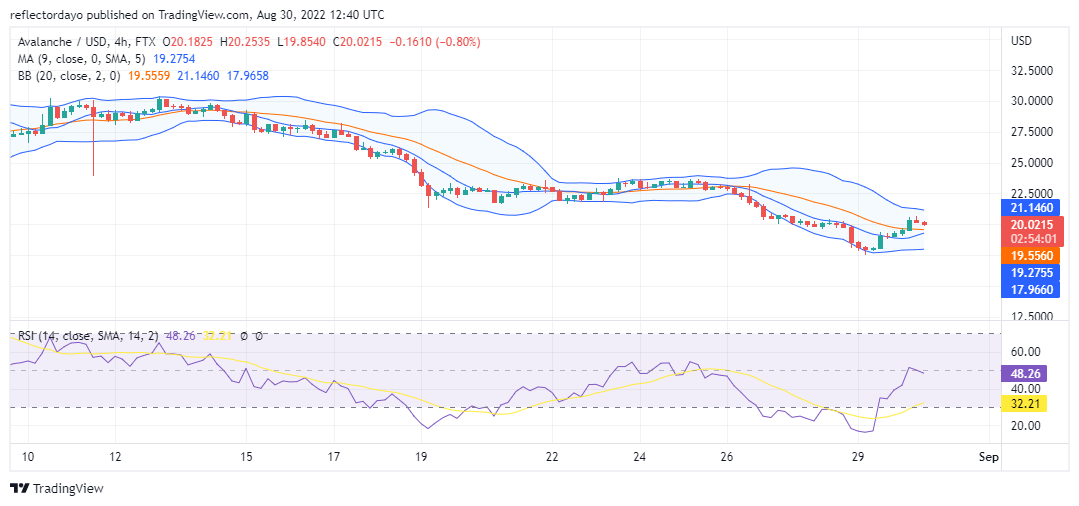
Avalanche Market Price Analysis: AVAX/USD 4-Hour Chart Outlook
Halfway into the day, the bullish move is weakening, and as a result of this, sellers are making their moves. However, the bearish moves do not appear to be strong enough. The RSI line is retracing the downtrend zone measuring at 48%. Because those bearish moves are not too strong, there is a probability that the market will continue to retrace an upper position.
Related
- How to Buy Tamadoge
- Visit Tamadoge Website
Join Our Telegram channel to stay up to date on breaking news coverage