Join Our Telegram channel to stay up to date on breaking news coverage
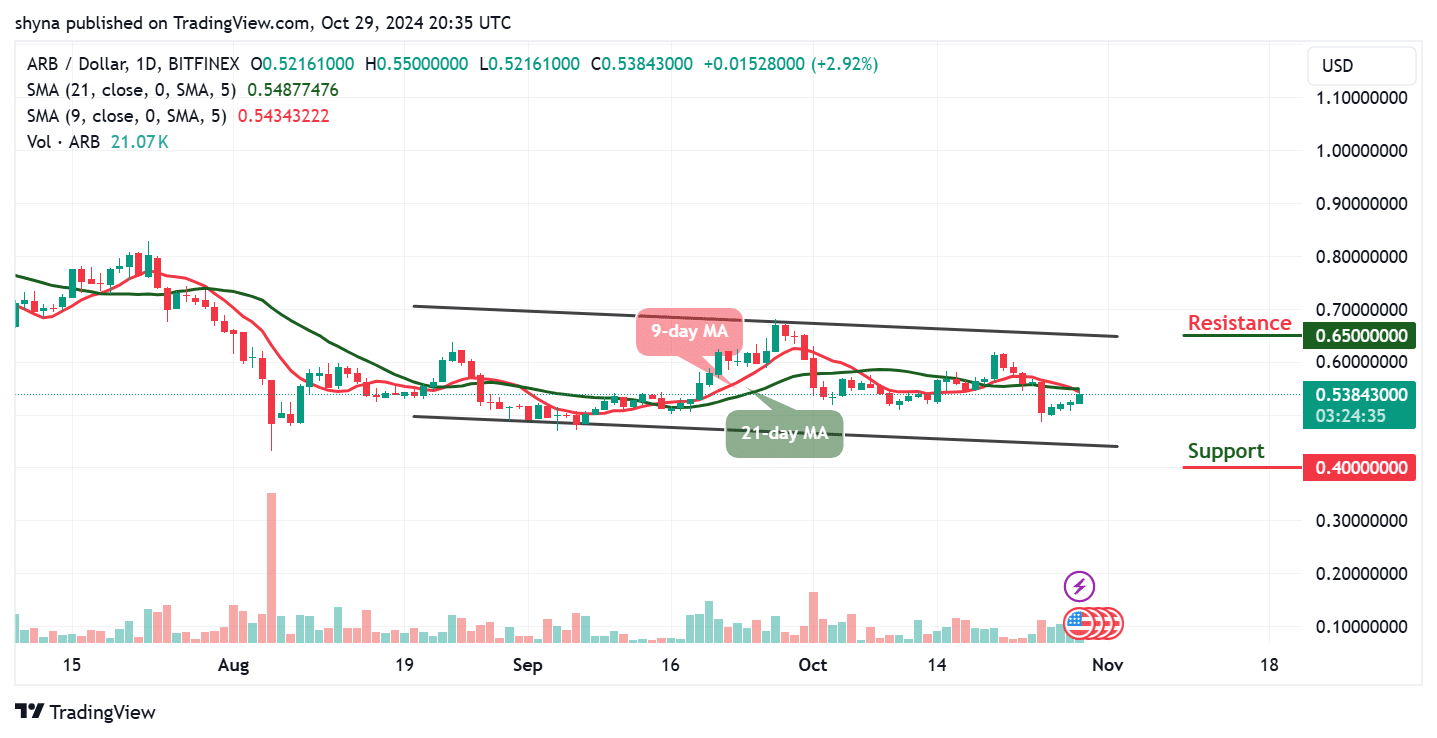
The Arbitrum price prediction reveals that ARB is moving bullishly with a gain of 2.92%, as the coin prepares for a bullish cross.
Arbitrum Prediction Statistics Data:
- Arbitrum price now – $0.53
- Arbitrum market cap – $2.16 billion
- Arbitrum circulating supply – 3.98 billion
- Arbitrum total supply – 10 billion
- Arbitrum Coinmarketcap ranking – #41
Getting into crypto projects early can often lead to strong returns, as shown by ARB’s price journey. In the past 24 hours, ARB has ranged between $0.5213 and $0.5495, while its all-time high was $2.40 on January 12, 2024, marking a drop of about 77.33% since then. Interestingly, its all-time low of $0.4317 on August 5, 2024, was followed by a rise of around 25.9%. Observing these patterns in ARB’s price history may provide useful insights for those considering investing.
ARB/USD Market
Key Levels:
Resistance levels: $0.65, $0.70, $0.75
Support levels: $0.40, $0.35, $0.30

ARB/USD recently experienced notable technical movements, trading near the 9-day and 21-day moving averages. Any break above this barrier could push the coin toward the upper boundary of the channel. Following the previous upward channel formation, ARB experienced a breakdown through its established support, threatening its bullish trajectory. Despite this, the price is currently attempting to re-enter the same channel, signaling a potential recovery.
Arbitrum Price Prediction: Would ARB/USD Break to the Upside
The Arbitrum price is currently trading within the 9-day and 21-day moving averages. Meanwhile, an increase toward the upper boundary of the channel could trigger intense buying to the resistance levels of $0.65, $0.70, and $0.75 respectively. However, if ARB/USD manages to re-enter the channel, the initial target level lies near $0.61, aligning with the significant downtrend resistance line. Moreover, this level could be crucial for assessing further momentum, as it has previously acted as a barrier to upward movements.
On the contrary, the Arbitrum price may likely hold a support level at $0.50 which could be the daily low. Therefore, if the Arbitrum price drops below this support level, it may likely hit the closest support at $0.45. Meanwhile, the critical supports could be located around $0.40, $0.35, and $0.30 if the selling volume increases. Nevertheless, the 9-day MA is likely to cross below the 21-day MA but the market may gain more upwards if it heads to the upside.
ARB/BTC May Continue the Bearish Movement
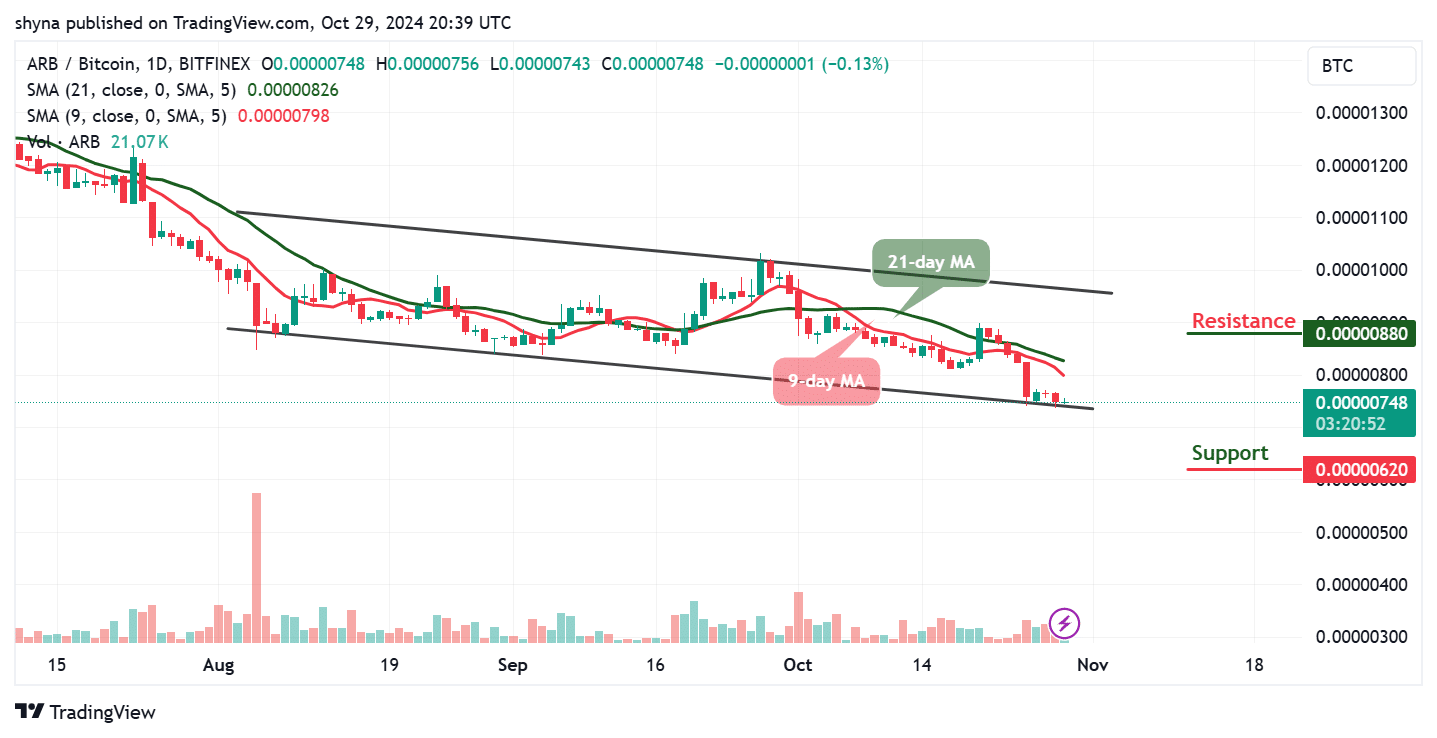
Against Bitcoin, the buyers failed to push the Arbitrum price above the 9-day and 21-day moving average within the channel. Meanwhile, from the upside, the nearest level of resistance lies near the upper boundary of the channel at 880 SAT and above.

In other words; the nearest support could be located at 700 SAT, if the price drops further to create a new low, lower support could be found at 620 SAT and below. Meanwhile, if the 9-day MA crosses above the 21-day MA, this could be a confirmation that the market may follow the upward movement.
Nonetheless, @rhaonnor explained to his followers on X (formerly Twitter) that $ARB has already tapped into the liquidity from the upper zone and is now poised to target the liquidity in the lower zone as a natural progression.
$ARB took the liquidity from the upper zone.
It will inevitably take the liquidity from the lower one. pic.twitter.com/nXAGdgGSAp
— Rhaonnor (@rhaonnor) October 28, 2024
Arbitrum Alternatives
The Arbitrum price is currently trading around the $0.53 level so that it may cross above the moving averages. Meanwhile, in the range of the descending channel, the closest resistance could be located at $0.55, with a close resistance at $0.60. However, if the market increases, additional resistance can be found near the upper boundary of the channel. At the moment, Pepe Unchained is positioned to capitalize on an anticipated ‘Meme Coin Super Cycle,’ with significant fundraising nearing $23.4 million and strategic development focused on a dedicated Layer 2 blockchain for meme coins. Market sentiment is currently optimistic, though not yet in overbought territory.
Pepe Unchained Passing $23 Million
Pepe Unchained’s Layer 2 aims to deliver increased speed, low fees, and robust security, making it an attractive option for investors looking to enter the market early. The project’s Builder Grants also make Pepe Unchained appealing to developers, who can contribute to its ecosystem through grant-funded applications. With analysts projecting up to a 10x return, this is a prime chance to join the next big meme coin movement.
Related News
- Arbitrum Price Prediction: ARB Soars 21% As Expert Says These Breakthrough AI Platforms Might 10X In 2024
- New Cryptocurrency Releases, Listings, & Presales Today – Pepe Unchained, Mei Solutions, LexiAI, Nx Token
Most Searched Crypto Launch - Pepe Unchained
- Exchange Listings December 10
- ICO Sold Out Early
- Featured in Cointelegraph
- Layer 2 Meme Coin Ecosystem
- SolidProof & Coinsult Audited
Join Our Telegram channel to stay up to date on breaking news coverage


