Join Our Telegram channel to stay up to date on breaking news coverage
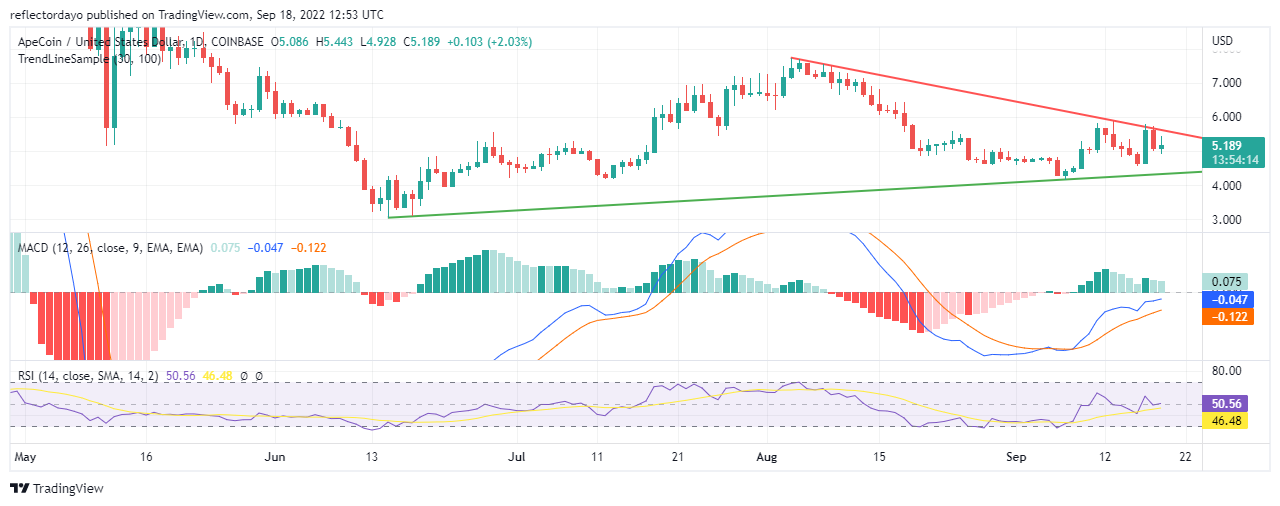
Looking at the converging trend lines, we can confirm that APE/USD is preparing for a period of price consolidation, after which the direction of the market will be determined. The market can go in either direction. Analysts and Traders just need to keep studying the behaviours of the market through the indicators and different timeframes so that they can be able to predict the next direction of the market.
Apecoin Market Price Statistic:
- APE/USD price now: $5.205
- APE/USD market cap: $1,592,020,515
- APE/USD circulating supply: 306,875,000
- APE/USD total supply: 1,000,000,000
- APE/USD coin market ranking: #33
Key Levels
- Resistance: $ 5.500, $6.000, $6.500
- Support: $4.623, $4.000 $3.500
Your capital is at risk
Apecoin Market Price Analysis: The Indicators’ Point of View
The symmetrical candlestick pattern is highly significant as it shows that the market is preparing to range sideways for a while. And this retracement could be in either market position. In confirmation of this sentiment, the RSI line is settling at the threshold that demarcates the upper market from the lower market. the RSI line now measures 51%. The signal line is catching up with the RSI at 47%. If the two lines converge as the market price consolidates then it will confirm the market expectation.
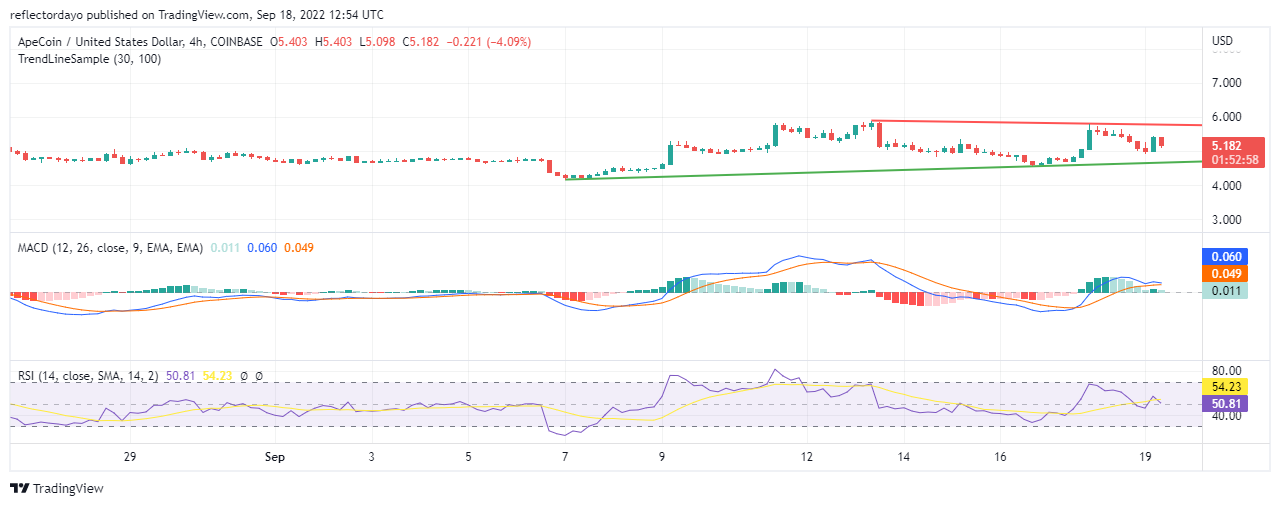
Apecoin: APE/USD 4-Hour Chart Outlook
The market here is in the upper market zone (bullish zone), but the market is falling. In the Moving Average Convergence and Divergence Indicator, we can see that the faster line is moving along very close to the slower line. And both of them are going on a horizontal pattern. The histograms of the indicator show that the bullish strength is reducing. The fact that the lines are very close to point zero and that both RSI line and the signal line are also moving at the midpoint of 50% confirms that the market is consolidating.
Related
Join Our Telegram channel to stay up to date on breaking news coverage