Join Our Telegram channel to stay up to date on breaking news coverage
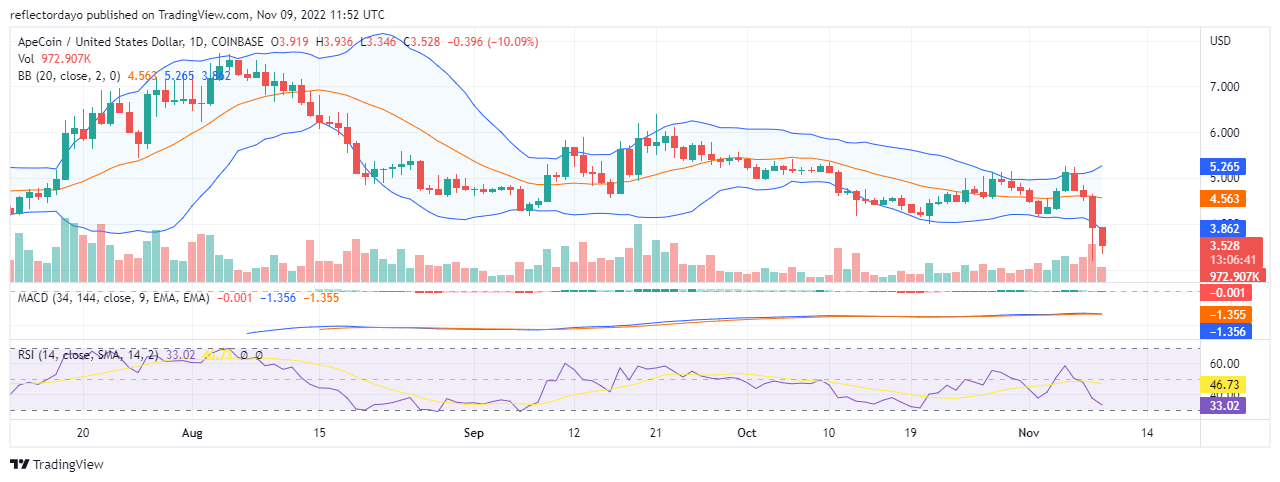
After Apecoin fell below the $5.000 price level on October 11, it was attempting on two occasions to beat this price level. Today’s bear market is the result of the second failed attempt to break the $5.000 resistance price level. The selling momentum increased between yesterday and today. So far, in today’s market, the bulls seem to be nowhere to be found.
Apecoin Market Price Statistic:
- APE/USD price now: $3.4
- APE/USD market cap: $1,024,332,534
- APE/USD circulating supply: 306,875,000.00
- APE/USD total supply: 1,000,000,000
- APE/USD coin market ranking: #41
Key Levels
- Resistance: $4.00, $4.50, $5.00
- Support: $3.00, $2.50, $ 2.00
Apecoin Market Price Analysis: The Indicators’ Point of View
Due to the erratic price movement, the upper band and the lower band of the Bollinger indicator widen out. The candlestick information for November 5 shows a very strong bull market. However, on November 6, the bear market is just as strong. The momentum of the bear market within the 3 days after the price was rejected is responsible for the diverging bands of the Bollinger indicator. It also means that the volatility is increasing.
APE/USD 4-Hour Chart Outlook
From this view, we can see that at the $5.130 resistance price level, the bears initially had to face off with the bulls over the price. Then bears gain the upper hand and the price falls. However, the bulls keep failing to maintain support levels at $4.6, $4.3, and $3.7 price levels. Considering the recent behaviour of the market in the past weeks and months, the downtrend may likely reverse soon. The price may retrace to $4.00
Dash 2 Trade (D2T) Token Is Selling Fast
A very important advantage of making use of Dash 2 Trade is that it gives the user the privilege to participate in investing in the projects at their earliest stages. D2T token is successful; it has raised close to $6m
Related
Join Our Telegram channel to stay up to date on breaking news coverage


