
Join Our Telegram channel to stay up to date on breaking news coverage
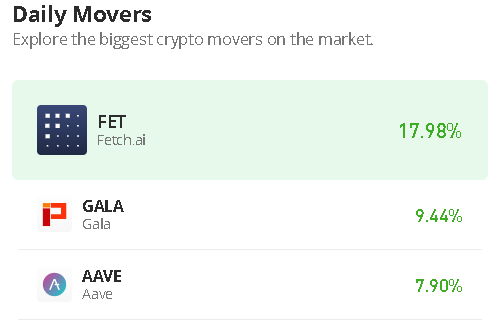
Aave price prediction shows that AAVE kicked off its rally as the coin continues to spike higher to touch the $91.2 resistance.
Aave Price Prediction Statistics Data:
- Aave price now – $86.62
- Aave market cap – $1.2 billion
- Aave circulating supply – 14 million
- Aave Coinmarketcap ranking – #40
AAVE/USD Market
Key Levels:
Resistance levels: $100, $105, $110
Support levels: $70, $65, $60
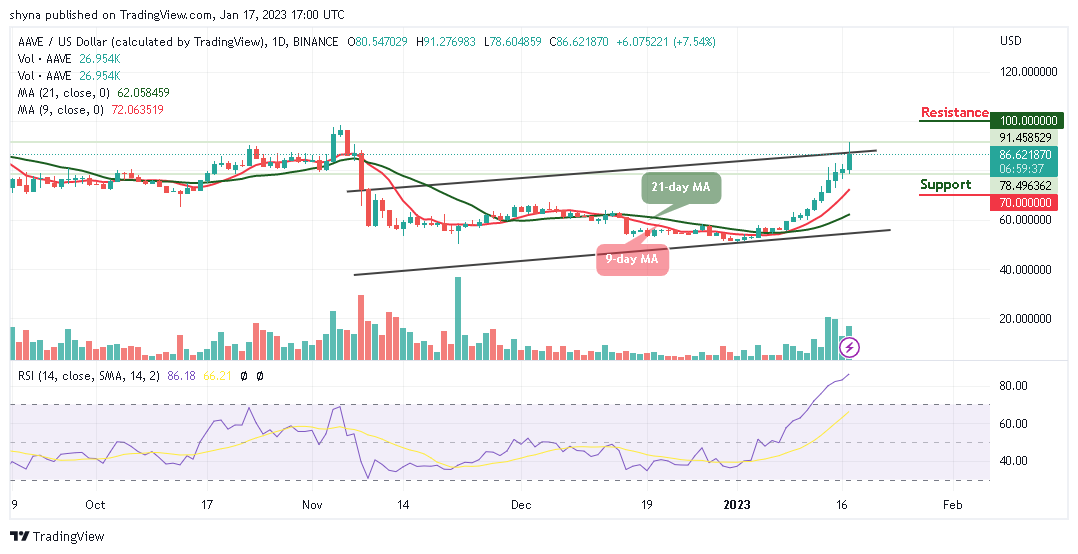
AAVE/USD had a significant boost that allowed the coin to exceed the $90 level, this momentum extending considerably as crypto continues to climb higher within the channel. However, the current performance of the coin indicates the addition of an upward movement. It’s just a matter of time before this coin reaches a $100 level in the nearest term.
Aave Price Prediction: What to Expect from Aave
In the last few days, the Aave price has moved from $58 to $91 and at the same time moved to cross above the upper boundary of the channel. Moreover, the ongoing trend may move a little bit higher before the sellers step into the market, and the coin could reach the nearest resistance at $95. If the bulls put more effort, it could hit additional resistance levels at $100, $105, and $110 respectively.
On the contrary, a bearish drop may roll the market back below the 9-day moving average and also to the initial support level of $75. Meanwhile, the critical support levels could be found at $70, $65, and $60. Therefore, as the trading volume increases, the technical indicator Relative Strength Index (14) is seen moving within the overbought region and this could still supply more bullish signals into the market.
Against Bitcoin, the Aave price is still trading near the upper boundary of the channel above the 9-day and 21-day moving averages. The price is changing hands at 4083 SAT as the technical indicator Relative Strength Index (14) remains within the overbought region. Meanwhile, the daily chart reveals that buyers may continue to dominate the market as the market price seems to break above the channel.
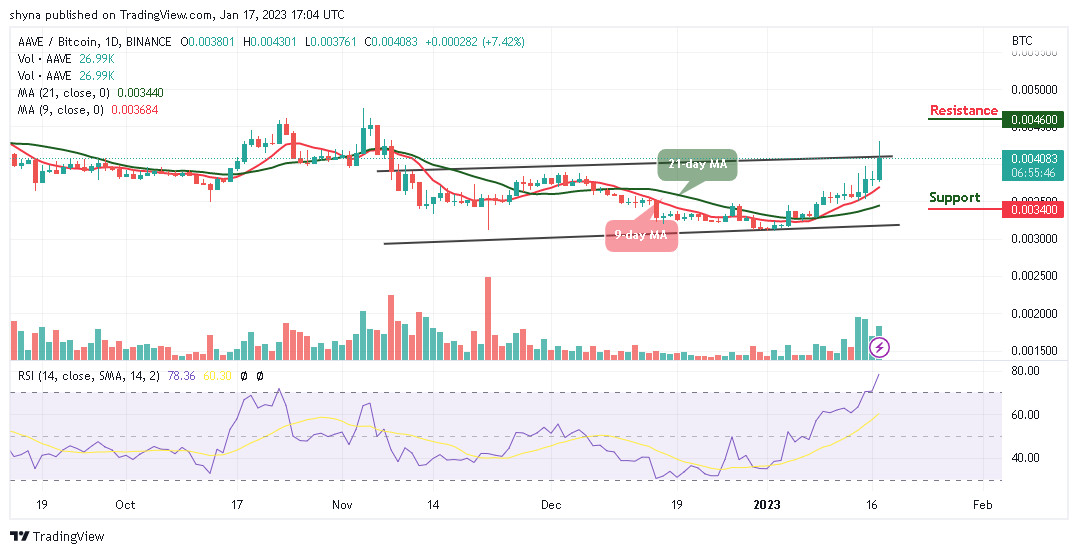
Positively, the resistance levels to be reached are 4600 SAT and above. In other words, a lower sustainable move may cancel the bullish pattern and it could attract new sellers to the market with the next focus on 3400 SAT and below.
Join Our Telegram channel to stay up to date on breaking news coverage