Join Our Telegram channel to stay up to date on breaking news coverage
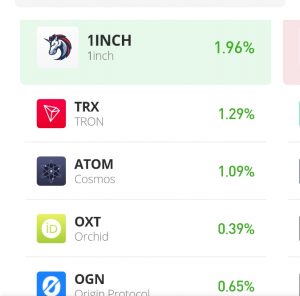
1inch inched to the top of the crypto daily mover today. This crypto displaced Terra Classic from the top of the list with its tiny movement of roughly 2% gain in value. However, whether tinny or big the fact rains that 1inch still is the crypto with the highest movement today. Consequently, this have made 1INCH/USD value climb higher.
1inch current value: $0.7300
1inch Market Capitalization: 385 Billion
1inch Total Supply: 1.5 Billion
1inch Rank: 79
Important Levels:
Resistance: $0.7500, $0.7750, $0.8000
Support: $0.7300, $0.7200 , $0.7100
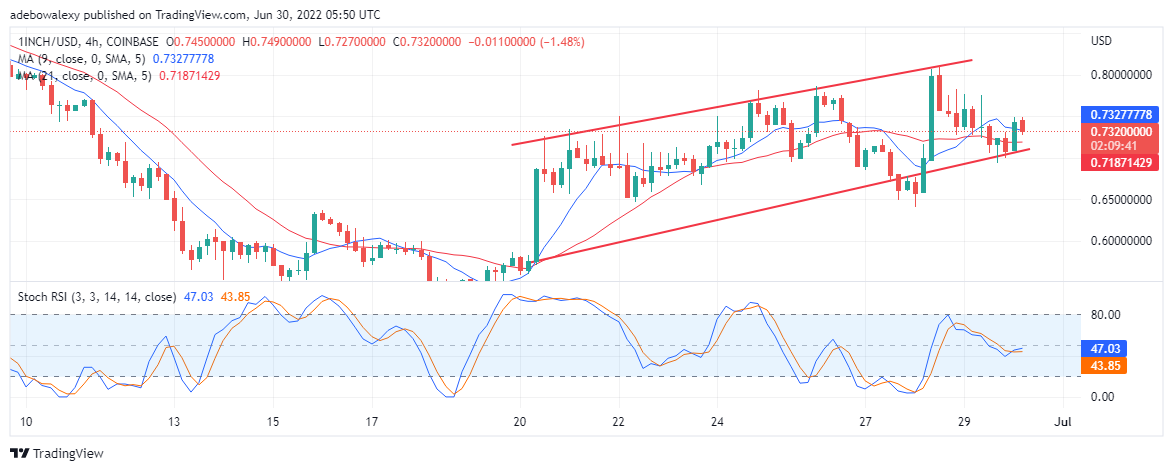
1Inch Value Forecast: 1INCH/USD Inches Higher
Examining the 1INCH/USD chart reveals the crypto’s recent value movement. From the chart, it seems the crypto recently has been trading in a slightly upward sloping price channel. And, this reflects the crypto’s recent movement Also, it could be perceived that the last three candles bounced off the floor of the price channel, while the last candle formed significantly beyond the channel floor.
Additionally, the 9 and 21-day Simple Moving Average have been able to cross below the price activity. Nevertheless, the slower 21-days SMA lies more significantly below the price activity, while the shorter 9-days SMA just nearly crosses below the value activity. Eventually, the value of 1inch crypto’ may rise further to around $0.7500 and $0.8000 if the SMA lines should cross each other.
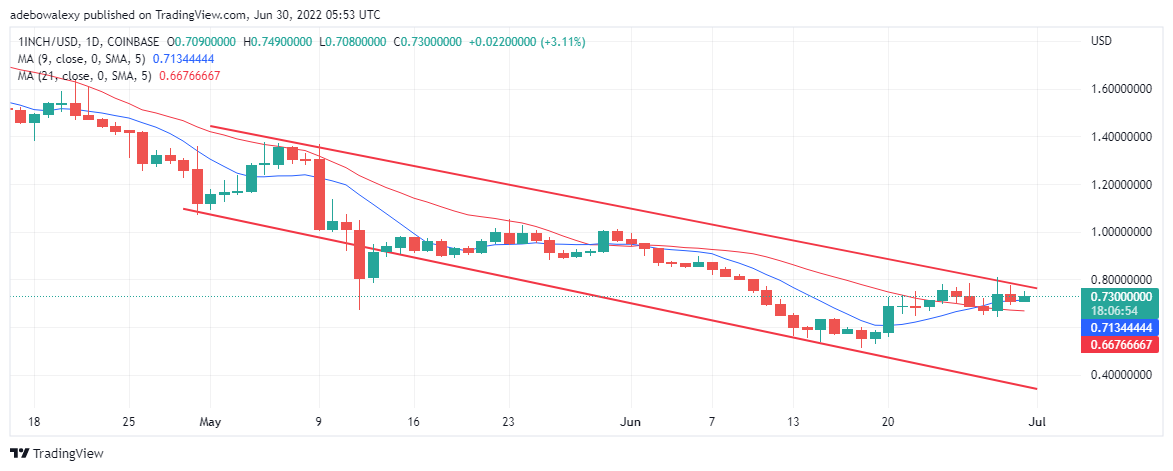
1Inch Value Prediction: 1INCH/USD Portrays Signs of More Inching Upwards
1INCH/USD daily chart is showing signs of the cryptocurrency inching even higher. Looking at the SMAs lines, we can perceive that the 9-day SMA has crossed significantly below the value movement. However, the lagging nature of the 21-day SMA line, we may assume that it will come lower. Eventually, these lines may cross each other, causing the price activity to move even higher. Nevertheless, traders may have to wait to see more signs of the lines crossing each other before making their moves.
Join Our Telegram channel to stay up to date on breaking news coverage