


Join Our Telegram channel to stay up to date on breaking news coverage
Like LTC, IOTA’s short term trend depends on if prices will close above the minor resistance trend line.
For IOTA, there are some spinning tops in the weekly chart while LTC sellers or BTC bulls continue to push prices lower towards the main double bottoms at 0.014 BTC in the 4HR chart.
In the mean time, close above key Fibonacci retracement levels from last week will determine NEM, Lumens and Monero rallies. Overly, I remain bullish and recommend longs in these coins.
Let’s have a look at other alt coin charts
BTC BULLS SLOW DOWN AS NEM FIND SUPPORT AT 0.000094BTC XEMBTC 4HR Chart for January 11, 2018
The general trend is up but from our entry chart, BTC buyers are pushing prices down with every higher high they make.
Relative to last week prices, NEM is down 60% and at current prices, bulls might as well jump in and drive prices higher.
Already we have that double bar reversal pattern at the 61.8% Fibonacci retracement level with immediate minor resistance being the middle BB.
Nevertheless-and despite our buy propositions, prices must close above 0.00010BTC or the 50% Fibonacci correction level as they sync with the overall trend before confirmation of buy pressure.
LUMENS CLOSE ABOVE MIDDLE BB INVITING FOR BUYERS XLMBTC 4HR Chart for January 11, 2018
XLM bulls might be having a hard time trying to figure what’s behind the rapid depreciation.
But, this is normal and given the size of large week’s candlestick-it was humongous by the way, volatility had to be tamed.
So far, Lumens have seen a 60% in price reduction and if today continues like it has been, this week’s candlestick might close as a bear forming a double bar reversal candlestick.
In case projection come to pass, longs should be null and void should prices close below 0.000032 BTC.
On the flip side since we are only looking for long positions, close above the middle BB will be inviting for Lumens buyers.
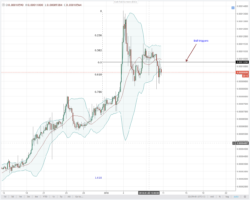
0.00025 BTC IS IOTA’S MINOR RESISTANCE LINE AND A POTENTIAL BULL TRIGGER IOTBTC 4HR Chart for January 11, 2018
After periods of higher highs in the weekly chart, the IOTA rally is finding resistance.
To verify, you can check the weekly chart where some spinning tops are clear with their result clear in our entry chart.
Because of that formation, IOTA is definitely at the precipice.
In the coming sessions, it can either sink or soar and that might all boil down to that minor resistance trend line in the 4HR chart.
Look at how it has formed a clear boundary.
Any break and close above 0.00025 BTC and the middle BB signals buy pressure and short term scalp traders should aim at last week’s highs of 0.00032 BTC in the coming sessions.
Conversely, if the resistance trend line acts as a ceiling then 0.00022 BTC will act as our immediate support. Overly, I recommend initiation of longs if prices stay above 0.00025 BTC.
MONERO PRICE REACTION AT MIDDLE BB MIGHT PUMP BULLS XMRBTC 4HR Chart for January 11, 2018
The moment Monero buyers pushed prices above 0.025 BTC earlier this week, they effectively committed themselves to maintaining prices above that price tag. Why? Because that close above concluded a break out trade and as usual, the candlestick must close as bullish to define the trend direction in the next couple of weeks.
Clearly, from the 4HR chart, we are beginning to see some reaction at the middle BB and this is good news for buyers.
Regardless of what happens, XMR a pull back in the coming sessions is desirable and
Join Our Telegram channel to stay up to date on breaking news coverage