Join Our Telegram channel to stay up to date on breaking news coverage
Despite a strong bearish sentiment, Pond Coin (PNDC) is among the trending coins on DexTools.io. In just 24 hours, PNDC has dropped by around 4% to trade at $0.00000196.
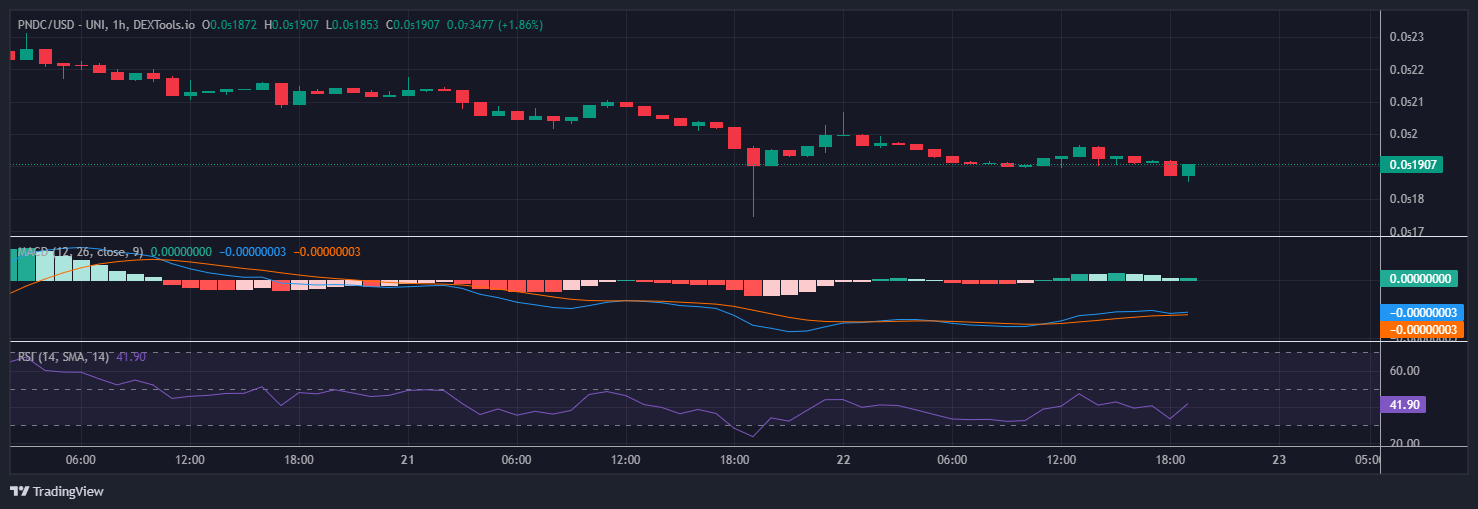
Pond Coin has been on a steady downtrend since September 19. While the current trend shows the possibility of a reversal, as traders accumulate at the low price, the buyer support ought to be strong enough to mimic a rally seen this month.
PNDC’s trading volumes in the last 24 hours are $1.55 million. Volatility is mild, as the price trades in the range of between $0.00000184 and $0.00000205.
PNDC is still holding 30-day gains of 21%. The all-time high level of $0.00000297 remains a far reach given the inactivity in the broader crypto market.
One positive development in the Pond Coin ecosystem is its DEX platform’s growth, which has posted 69,000 swaps and $90 million in total volumes.
https://twitter.com/Pond0x/status/1704625585052373158
PNDC Posts A Bearish Sentiment As Bears Take Control
PNDC’s price action is bearish, with the recent 4% drop in just 24 hours. The seven-day drop currently stands at 20% as the price continues a steady correction after a decent rally earlier this month.
After creating several green candles over the past day, PNDC appears ready for another rally. The $0.00000189 level seems to be an excellent entry level for traders. If many buy orders have been set at this price, a breakout could be on the horizon.
However, there appears to be uncollected liquidity at $0.00000174, and bears could push PNDC lower to this price.
A crucial resistance level lies at $0.00000199. On September 21, a liquidity grab pushed PNDC’s price to $0.00000207 before a swift correction.
Will PNDC Climb 20% As Buyer Support Holds?
The Relative Strength Index (RSI) shows buyers are responsible for PNDC’s price action. The RSI sits at 47, a neutral zone between buyers and sellers.
The RSI line has sharply moved to the upside, indicating that buying pressure is building. The movement of the RSI line is bullish as it indicates the likelihood of a short-term upswing.
On the other hand, the Moving Average Convergence Divergence (MACD) line is bearish as it is currently on the opposing side. However, the MACD line is also tipping north, and the histogram bars are green, showing the possibility of an upswing.
Wall Street Memes Set To Explode After Raising Over $25M In Presale
There is much hype around the Wall Street Memes presale that has raised more than $25M since its launch in late May. The presale now has only three days left before closing.
1 WSM currently trades at $0.0337, with the token set to explode once it hits exchanges. WSM will debut on exchanges on September 27, and given the interest that the presale has received, the listing could trigger massive gains.
The Wall Street Memes staking dashboard also shows the pool gaining momentum. According to the staking dashboard, more than 369 million WSM tokens have been locked up.
Related Stories:
- Pond Coin Price Prediction: Is a 40% Rise in PNDC’s Future?
- Pond Coin (PNDC) Price Glimpse
- Pond Coin Price Prediction: PNDC Remains Bearish
Best Wallet - Diversify Your Crypto Portfolio
- Easy to Use, Feature-Driven Crypto Wallet
- Get Early Access to Upcoming Token ICOs
- Multi-Chain, Multi-Wallet, Non-Custodial
- Now On App Store, Google Play
- Stake To Earn Native Token $BEST
- 250,000+ Monthly Active Users
Join Our Telegram channel to stay up to date on breaking news coverage


