Join Our Telegram channel to stay up to date on breaking news coverage
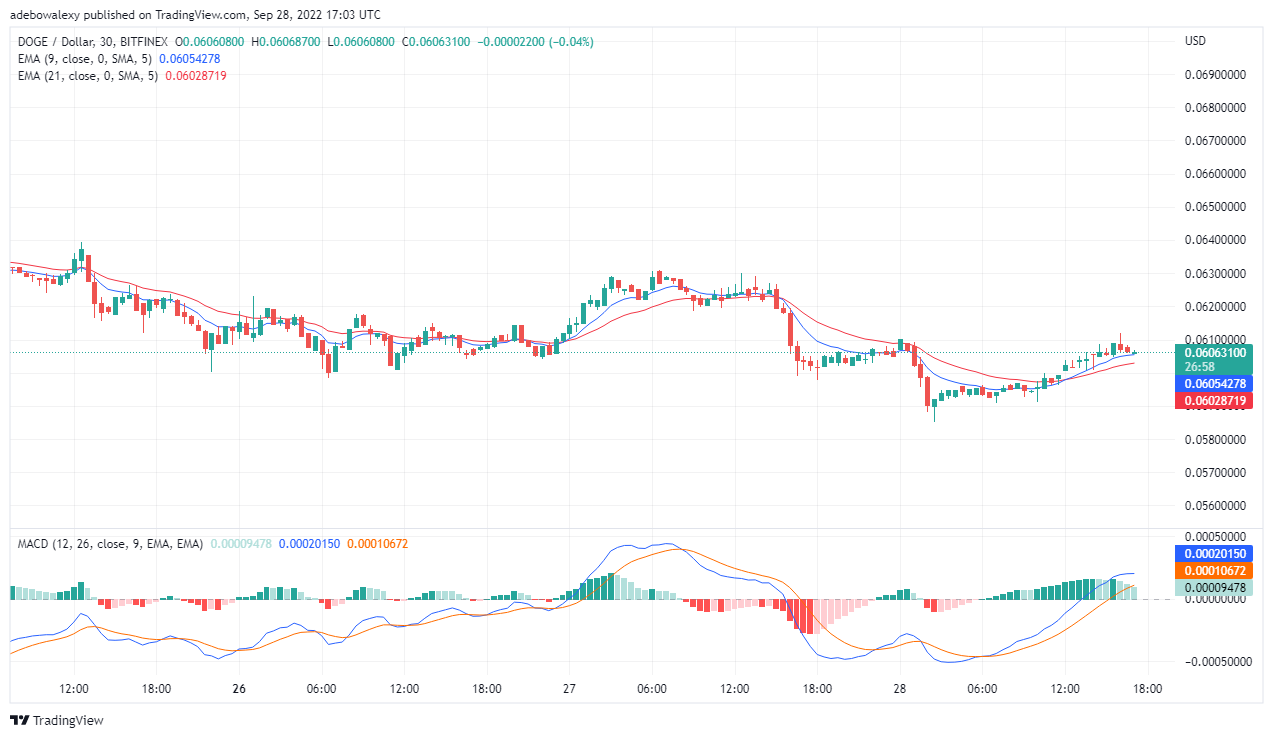
The DOGE/USD market lack direction, as price action has resulted into trading in a sideways manner. This sideways trend started since the beginning of this month, has continued till now.
Dogecoin’s Analysis Statistics Data:
DOGE’s value now: $0.0607
DOGE’s market cap: $8.1 billion
Dogecoin’s moving supply: 132.67 billion
The Total supply of DOGE’s: 132.67 billion
Dogecoin’s Coinmarketcap ranking: #10
Therefore, it is imperative for us further examine this market, to correctly make trading decisions in this market. This price deduction will as well cover the DOGE/BTC market too, for the sake of traders who trades the pair.
Crucial Price Marks:
Resistance Marks: $0.0607, $0.0633, $0.0654
Support Marks: $0.0580, $0.0550, $0.0520
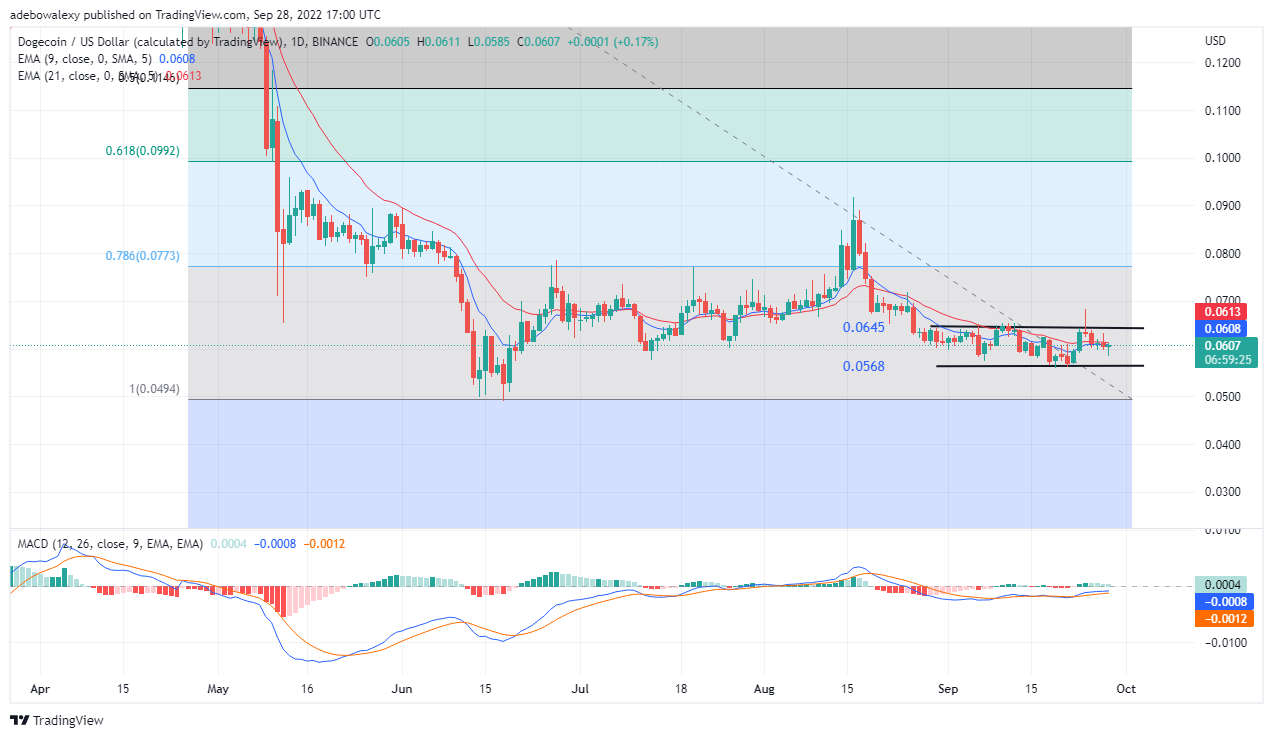
Dogecoin’s Price Analysis: DOGE/USD Unwilling to Break Upwards
The DOGE/USD daily market reveals that both buyers and sellers are generally matched and as a result price direction has been undecided. Currently, DOGE/USD trades in between a narrow price range of $0.0645 -$0.0568. Also, the EMA lines have trapped the last candle on this chart which marks the current trading session. Furthermore, the Moving Average Convergence Divergence indicator stays below the 0.00 level. Meanwhile, the histogram of the MACD indicator grows slowly above the 0.00 mark. Consequently, the activities on the MACD show that there isn’t much energy on the buyers’ side, and price action may not break the $0.0645 level.
Dogecoin’s Price Analysis: DOGE/BTC Market Is Retracing Downward
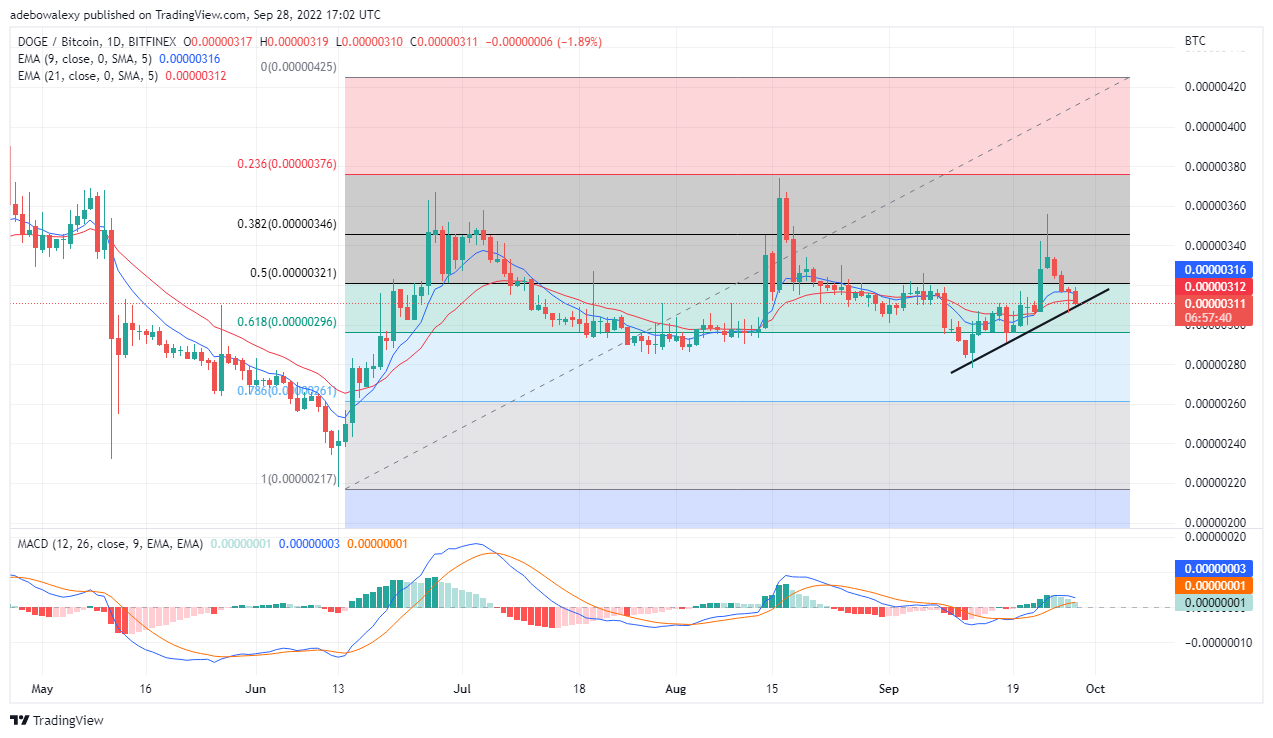
After price action in the DOGE/BTC market reached tested the 38.20 Fibonacci level, it has sharply retraced downwards. The EMA lines cut across the most recent bearish candle on this chart. If eventually, this current session should end in favor of the bulls then we may witness a correction to the upside in this market.
Your capital is at risk.
However, it is more likely that the aforementioned correction will occur off the 61.80 Fibonacci level of price 0.00000296. Traders can anticipate this level as a potential entry into this market since an upward correction may occur from here. The MACD only portrays the current situation of the market. Therefore, traders should anticipate the Fib 61.80 level.
Join Our Telegram channel to stay up to date on breaking news coverage
