
Join Our Telegram channel to stay up to date on breaking news coverage
The Bitcoin price prediction may begin to follow the sideways movement as the coin trades around $21,338.
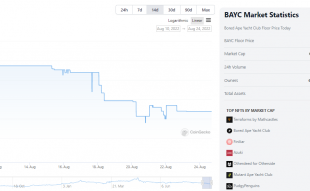
Bitcoin Prediction Statistics Data:
- Bitcoin price now – $21,338
- Bitcoin market cap – $407.6 billion
- Bitcoin circulating supply – 19.1 billion
- Bitcoin total supply – 19.1 billion
- Bitcoin Coinmarketcap ranking – #1
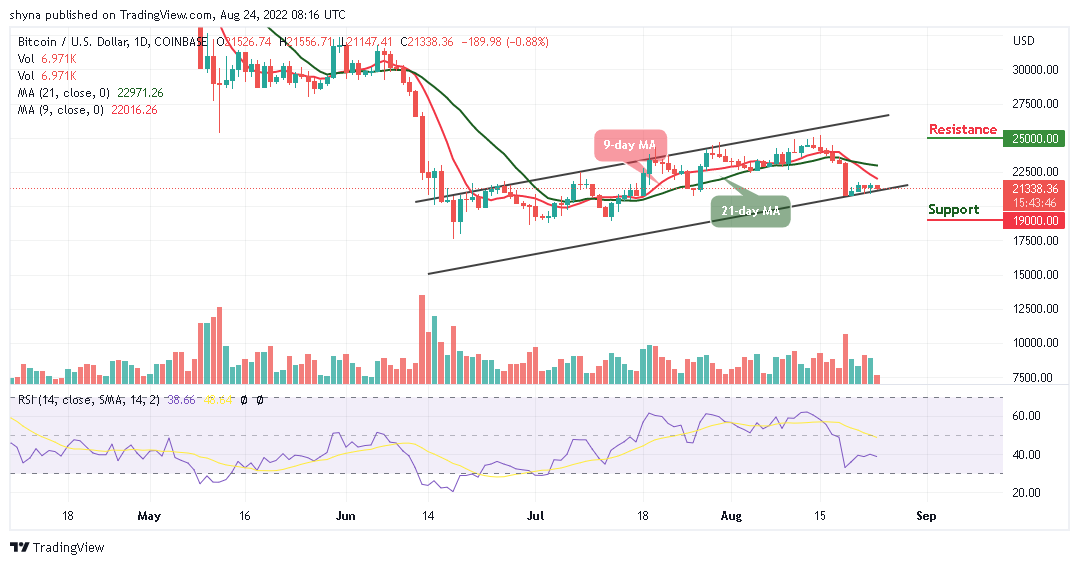
BTC/USD Long-term Trend: Ranging (Daily Chart)
Key levels:
Resistance Levels: $25,000, $27,000, $29,000
Support Levels: $19,000, $17,000, $15,000
Your capital is at risk
BTC/USD is likely to experience another unexpected selloff if the Bitcoin price crosses below the lower boundary of the channel. Today, the Bitcoin price drops slightly to touch the support of $21,147 after touching the daily high of $21,556. However, a reversal could play out if the king coin trades above the 9-day moving average, and this may send BTC/USD towards the upper boundary of the channel.
BTC Price May Consolidate as the outlook on Tamadoge is Bullish
The technical indicator Relative Strength Index (14) reveals that the Bitcoin price is consolidating below 9-day and 21-day moving averages, and any drop towards the south could lead the coin to cross the lower boundary of the channel. However, the technical indicator Relative Strength Index (14) may trade sideways as the signal line moves in the same direction below the 40-level.
On the upside, recovery may not come now but any attempt to cross above the moving averages could push the coin to the resistance levels of $25,000, $27,000, and $29,000 respectively. On the contrary, any bearish movement below the channel may force the Bitcoin price to reach the support levels at $19,000, $17,000, and $15,000.
BTC/USD Medium-term Trend: Bearish (4H Chart)
On the 4-hour chart, the Bitcoin price is hovering within the 9-day and 21-day moving averages. The chart reveals that the coin touches the support level of $21,262 as the market moves sideways. However, BTC/USD is likely to follow the bearish movement if the coin heads toward the lower boundary of the channel as the critical support could be located at $20,000 and below.
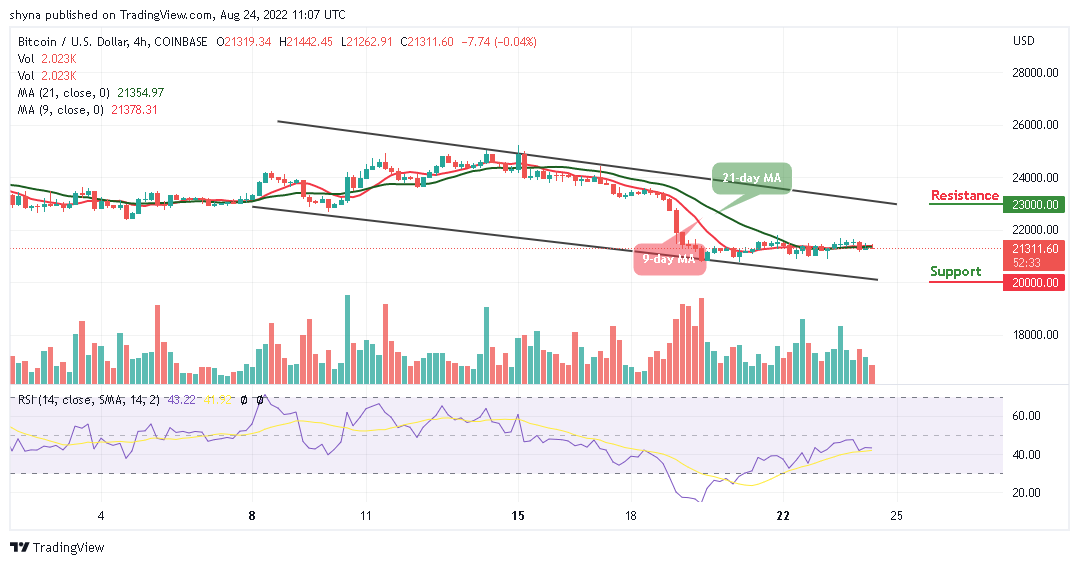
Moreover, if the price bounce above the 9-day and 21-day moving averages and heads to the upside, the Bitcoin price may reach the resistance level of $22,000 and above. Now, as the technical indicator Relative Strength Index (14) moves above the 40-level, the king coin is likely to experience a slight bullish movement.
Tamadoge has assimilated the lessons learned from other projects. Revenue is generated by fees paid on transactions in the Tamadoge NFT Petstore, where players buy clothes, food, and other necessities and discretionary items for their pets. You can own as many pets as you like, with the individual traits of each Tamadoge pet constituted as an NFT.
Related:
Join Our Telegram channel to stay up to date on breaking news coverage