Join Our Telegram channel to stay up to date on breaking news coverage
LTC Price Prediction – April 16
The LTC/USD trading operations have managed to spring upward to test the resistance level of $300 during today’s session. As it is, the crypto’s point hasn’t shown a complete loss of momentum in its fresh less active pushing efforts against the US Dollar as of writing.
LTC/USD Market
Key Levels:
Resistance levels: $300, $320, $340
Support levels: $240, $220, $200
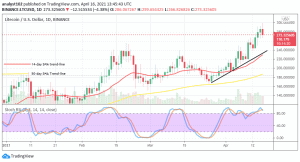
LTCUSD – Daily Chart
It shows that the LTC/USD daily chart gives a kind of straight-line bullish path as the crypto’s price surges stronger to the north. The 14-day SMA trend-line is left below the current market’s trading zone with the bullish trend-line drawn northwardly to point at the support level of $240. The 50-day SMA indicator has moved briefly past the $180 level to point towards the north direction. The Stochastic Oscillators are more of moving in a consolidation state around range 80 and the overbought region. That suggests that buying pressures are waxing at a higher rate against any possible decline of the market presently.
What formation pattern could be the next LTC/USD trade outlook?
As at the present, the potential of the LTC/USD bulls keeping a high value on an increasing note hasn’t faded off. As a result, more efforts are expected that buying pressures maintain in the next more trading days’ sessions to come. More so, it is apparent that the crypto-market is in a strong buying consolidation moving outlook.
However, there can be an entry for a sell order of this market especially while the price firstly surges to the north and gets a slight resistance. But, it is not safe to keep a long sell position currently at even most of the resistance trading levels. It is not expected of the bears to push back the crypto’s value down to the support level of $240 in the near time.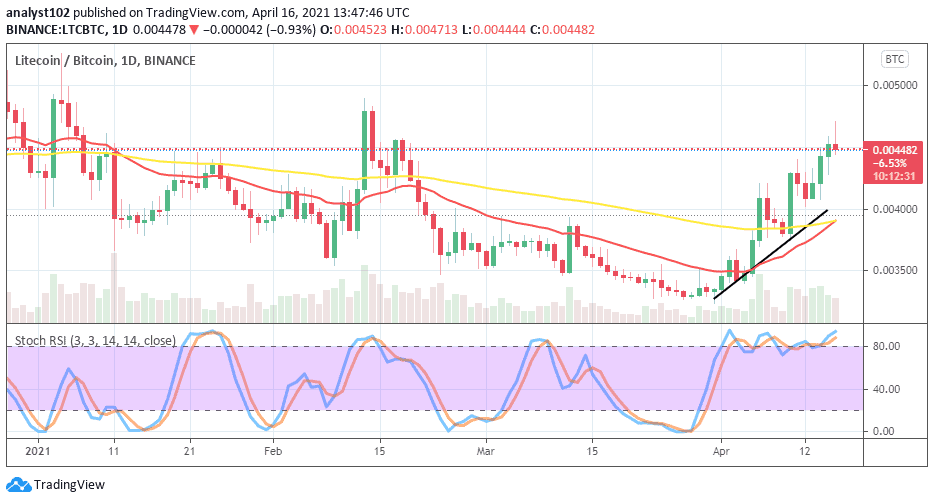
LTC/BTC Price Analysis
Putting the energy-pushing efforts between LTC and BTC in comparison, it is still accepted that the base crypto is having a stronger stance as paired with the counter crypto on the daily trading chart. Over time, the 14-day SMA trend-line and the bullish trend-line are located below the trading zone of the two instruments pointing to the north showcasing the degree to which LTC is maintaining against BTC. Also, the 50-day SMA indicator is located across the bullish trend-line and, with a close touch of the smaller SMA to of more pointing towards the east. That signifies that the base crypto may still have to witness some levels of less-impulsive price action at that trading area. The Stochastic Oscillators are now in the overbought region moving in a consolidation manner. That suggests that the base crypto is still having a harder weight to some extent.
Join Our Telegram channel to stay up to date on breaking news coverage