Join Our Telegram channel to stay up to date on breaking news coverage
Bitcoin (BTC) Price Prediction – January 17
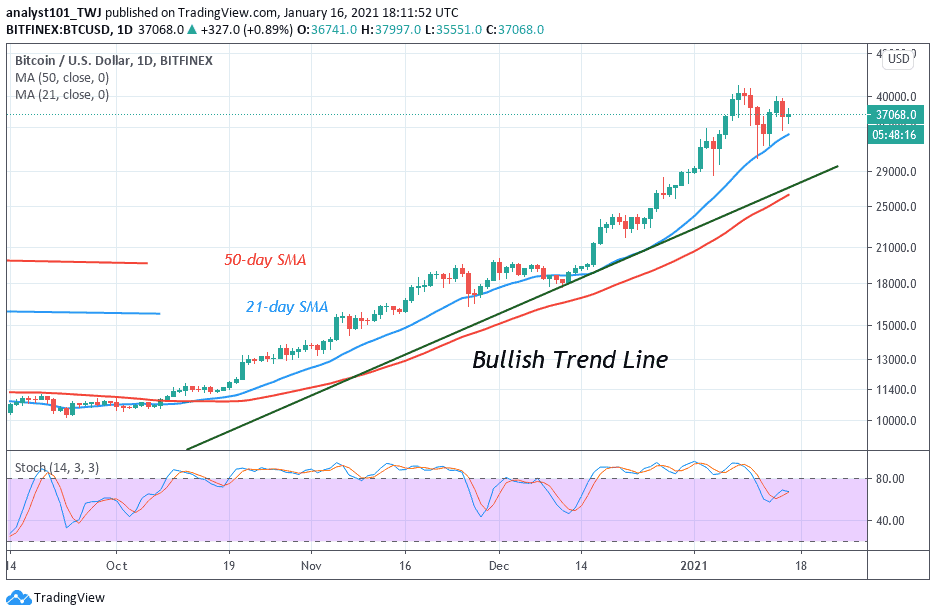
As reveals by the daily chart, the Bitcoin price has been fluctuating, struggling with high resistance levels.
BTC/USD Long-term Trend: Bullish (Daily Chart)
Key levels:
Resistance Levels: $42,000, $44,000, $46,000
Support Levels: $30,500, $28,500, $26,500

BTC/USD is currently struggling to clear the $37,000 resistance level. At the time of writing this, The Bitcoin price is consolidating losses just below the $36,000 level at its current price of $35,716. Meanwhile, in the coming sessions, bulls need to keep prices above $36,000 to avert a downside break below $35,000. Nevertheless, any more losses could open the doors for a dip below the $33,000 level in the near term.
What to Expect from Bitcoin (BTC)
The Bitcoin price may end up consolidating in the next few days as the coin has been rubbing up against several key moving averages. More so, BTC/USD could enter a phase of sideways trading that would mark a prime time for the coin to break out. But first, the first digital asset would have to break through a stiff support barrier between $34,500 and $36,500. Although the odds seem to favor the bears, therefore, a sudden spike in buy orders may have the strength to jeopardize the current bearish outlook.
However, the technical indicator RSI (14) is seen trading below the 60-level but if the bulls could push the market above the 9-day moving average, the cryptocurrency is expected to move towards the higher resistance level of $40,000 so that it can touch the potential resistance levels at $42,000, $44,000, and $46,000. Nevertheless, any bearish movement below the moving averages may likely bring back the Bitcoin price to the supports at $30,500, $28,500, and $26,500 respectively.
BTC/USD Medium – Term Trend: Ranging (4H Chart)
On the 4-hour chart, a retest of $35,000 gives the impression that the bulls are not yet done. The Bitcoin price rises to fill a significant gap as the bulls regain strength and take the coin towards the $36,000. In a short time, BTC/USD may hit $38,000 if the bullish pressure continues. Otherwise, the price may revisit the supports of $32,400 and below.
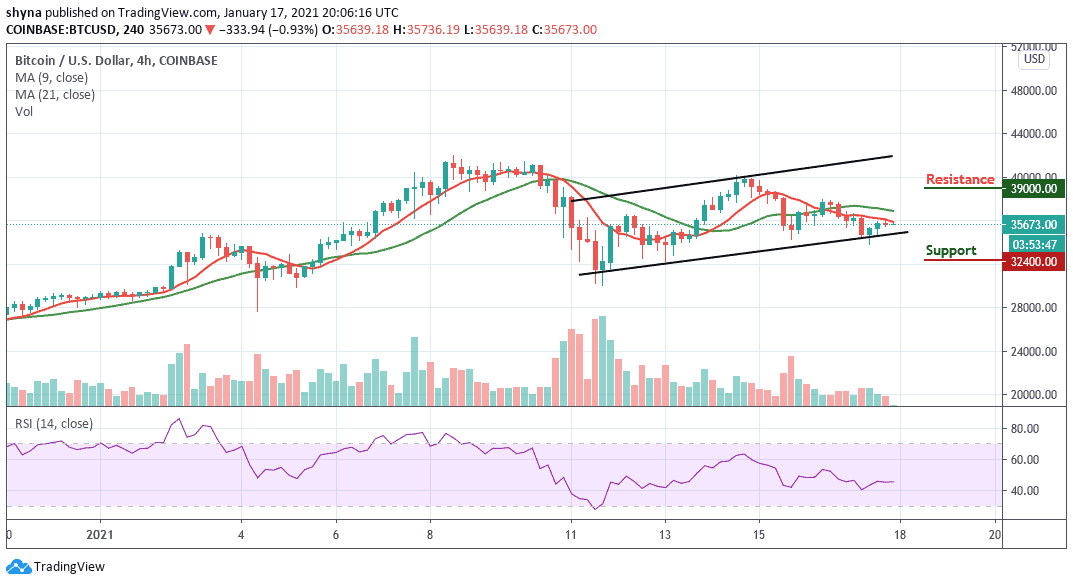
On the upside, a bullish continuation may likely meet the resistance at $39,000 and above. Presently, the RSI (14) is moving around 45-level, this could mean that the BTC/USD may continue to follow a sideways movement. Meanwhile, a significant cross below the channel may send the market in a bearish scenario.
Join Our Telegram channel to stay up to date on breaking news coverage