Join Our Telegram channel to stay up to date on breaking news coverage
Bitcoin (BTC) Price Prediction – August 31
Bitcoin (BTC) hit the intraday high at $11,784 and the coin is seen retreating below $11,700.
BTC/USD Long-term Trend: Bullish (Daily Chart)
Key levels:
Resistance Levels: $12,500, $12,700, $12,900
Support Levels: $11,000, $10,800, $10,600
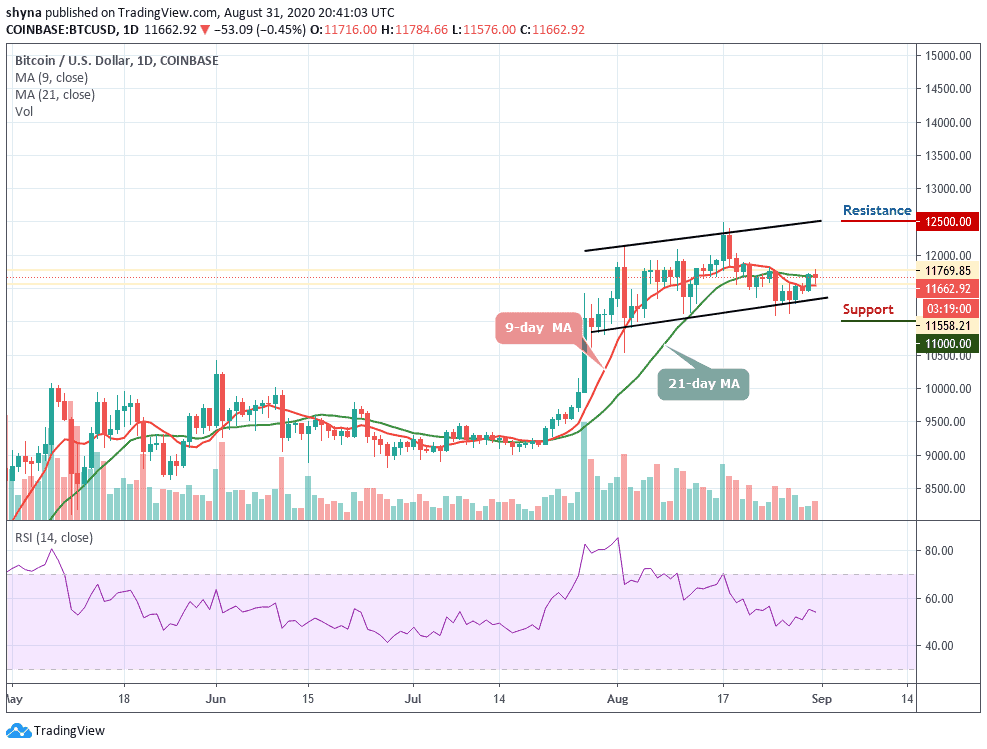
BTC/USD is settling around $11,600, but what direction will BTC head next? The thing is, there is no consensus; since BTC/USD has bounced off a historical uptrend, it may likely enter back into a bull phase but if the coin tries to retest the $11,300 low, it may collapse further to form a longer-term bear sequence.
Would Bitcoin Cash Go up or Down?
BTC/USD is trading at $11,662 displaying an intraday loss of 0.45%. The prevailing trend is range-bound with expanding volatility. Therefore, a break down below the 9-day moving average may likely continue in the direction of the previous trend. In this case, Bitcoin could fall below $11,200 support and further movement may hit the critical supports at $11,000, $10,800, and $10,600.
However, should Bitcoin price hold the price to remain above the 21-day moving average and move up; the price could move to $12,000 vital resistance. A further high drive could send the coin to $12,500, $12,700, and $12,900 resistance levels. Meanwhile, the RSI (14) has recently revealed a sign of trend reversal, which shows a possible bearish momentum may likely play out.
BTC/USD Medium-Term Trend: Bullish (4H Chart)
At the opening of the market today, the Bitcoin price first went down to touch $11,574 low, from where it takes the market price to where it is currently trading at $11,701. Should the price continue to drop further and move below the 9-day and 21-day moving averages, it could reach the nearest support levels at $11,500 and below.
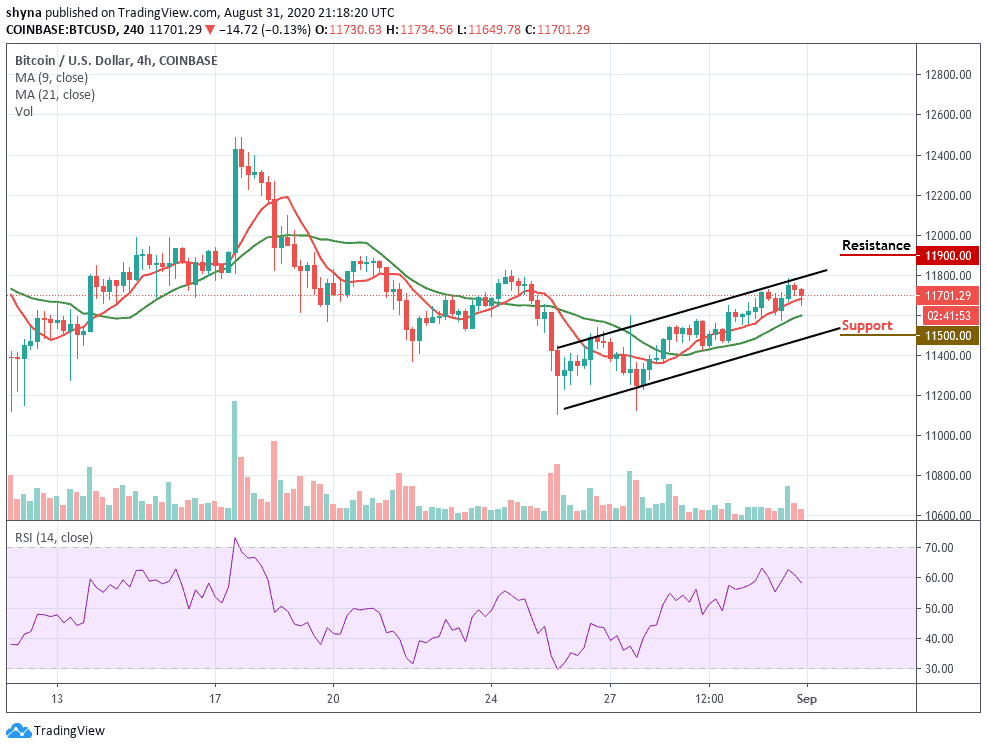
Moreover, if the bulls take the coin above the channel, BTC/USD may hit the potential resistance at $11,900 and above. Presently, the market may follow the downward trend as the RSI (14) indicator nosedives below the 60-level.
Join Our Telegram channel to stay up to date on breaking news coverage