Join Our Telegram channel to stay up to date on breaking news coverage
ETH Price Prediction – November 10
Ethereum coin has started trading today on a positive note and has traced a bullish trend line since the beginning of today.
ETH/USD Market
Key Levels:
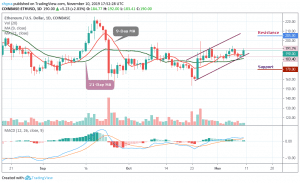
Resistance levels: $205, $210, $215
Support levels: $170, $165, $160
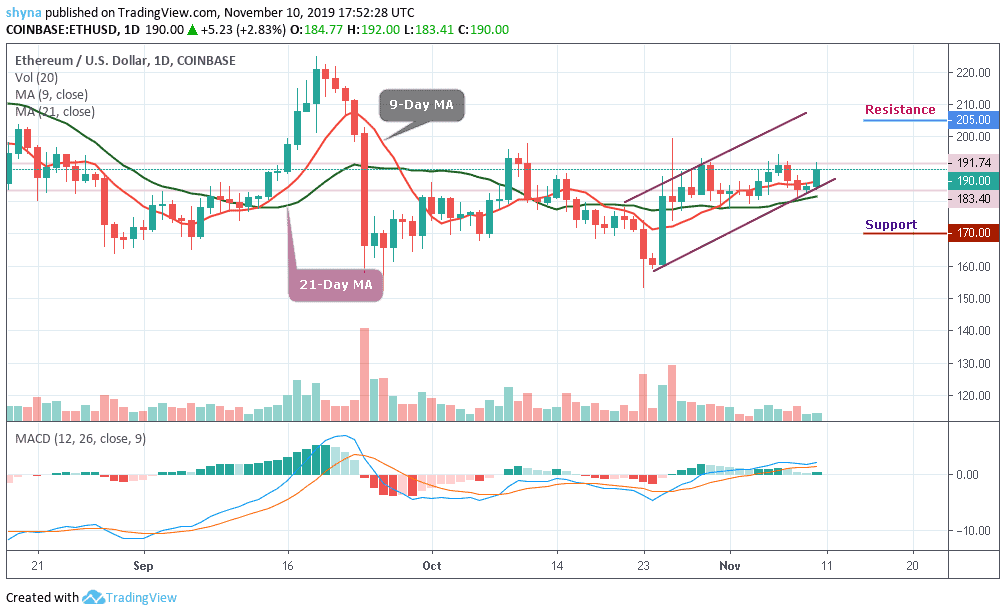
A couple of days ago, ETH/USD price saw a notable price decline, followed by a rebound. The coin continues the rebound today, since this morning, Ethereum price has not broken the uptrend except for the recent correction. The coin has climbed above $187 from its today’s opening price of $183.40.
Moreover, Ethereum price is currently changing hands at $189 level, the crypto is trading above the 9-day and 21-day moving averages. If there is a bullish break above the resistance level at $195, Ethereum’s price could continue to accelerate in the short term. The next stop for the bulls could be $200, followed by $205, $210 and $215 resistance levels.
Conversely, if there is no increase above $195, the price could fall below the support level of $185. If there is a downside break, there could be sharp losses below the $180 and $175 levels. In the mentioned case, the price may even slide below the $170, $165 and $160 support levels. The MACD for ETH/USD is slowly moving within the bullish zone, with a few positive signs.
Taking a look at the daily chart for ETH/BTC, one can see that the price is attempting to rise towards the support turned resistance. Until and unless this resistance is effectively breached and the price ends up closing above it, there is no much reason to expect any long term bullish reversal.
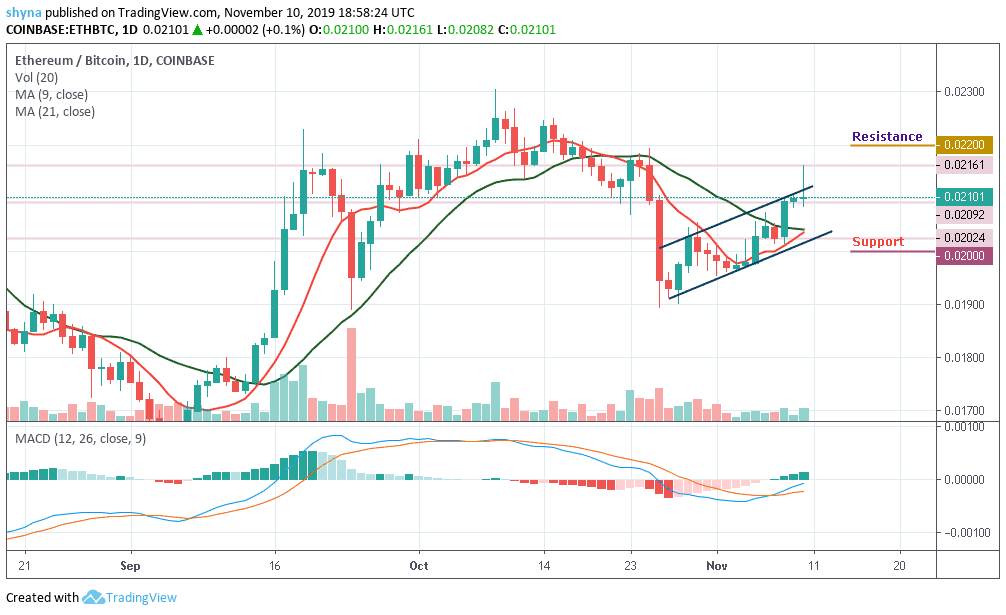
However, a possible bearish trend is likely to meet major support at the 2000 SAT before falling back to the 1950 SAT and 1900 SAT but if the price hold, the buyers may continue to push the market to the critical resistances at 2200 SAT, 2250 SAT and 2300 SAT. The MACD now trying to recover from the long-term minus-zero level and a bullish cross could set the price off a channel break. A rejection will reduce the market to lower levels.
Please note: Insidebitcoins.com is not a financial advisor. Do your research before investing your funds in any financial asset or presented product or event. We are not responsible for your investing results.
Join Our Telegram channel to stay up to date on breaking news coverage