

Join Our Telegram channel to stay up to date on breaking news coverage
ETH/USD
On Friday the price of Ethereum was sitting at $136.78 at its lowest from where an increase has been made to around $140.41 at its highest point on Saturday as the price started moving to the downside again and came to around $134.23 at its lowest point today where it is currently being traded.
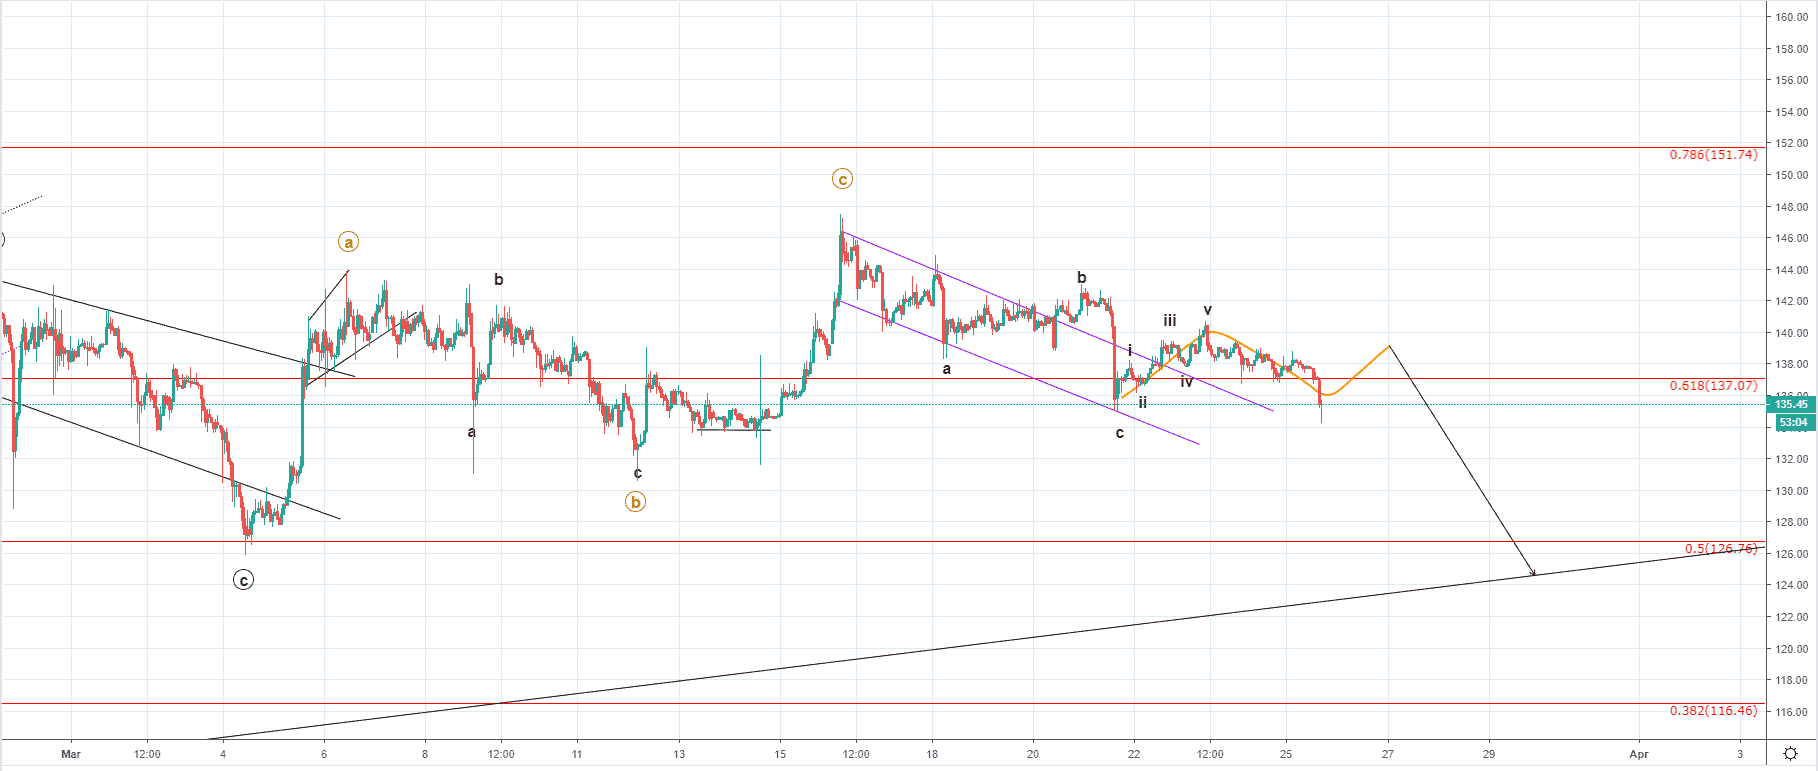
On the hourly chart, you can see that the price of Ethereum fell below the 0.618 Fibonacci level which served as support and but since a large wick from the downside of the last hourly candle occurred indicating buying pressure we are likely to see the price again above the Fibonacci level or at least a retest of it for resistance.
The price fell to the level of last Thursday’s low which was the impulsive move to the downside after a corrective increase which has been labeled as a C wave of the ABC correction to the downside after the C wave of a Minute degree to the upside ended.
As we are most likely seeing the start of another structure to the downside out of which the current wave structure would be the first wave of a higher degree, more downside would be expected from here. But first, we are most likely going to see a retest of the broken horizontal support level or even a quick peek above it which would trigger another round of selling.
I was expecting an interaction with the 0.786 Fibonacci level for the ending point of the C wave which could still occur if we are seeing the 4th wave prolongation but as the price decreased impulsively on Thursday last week I don’t believe that’s likely.
More likely we are seeing the start of another impulsive decrease to the downside which is a continuation of the initial decrease made on 24th of February when the price of Ethereum fell by over 20% in one go.
Zooming out on to the 4-hour chart, we can see that the price of Ethereum broke the minor ascending support line which also indicates that the price is now likely heading downwards the next significant support level which is the ascending trendline made by the current Intermediate WXY correction to the upside that started on December 15th when the price of Ethereum was $83.11.
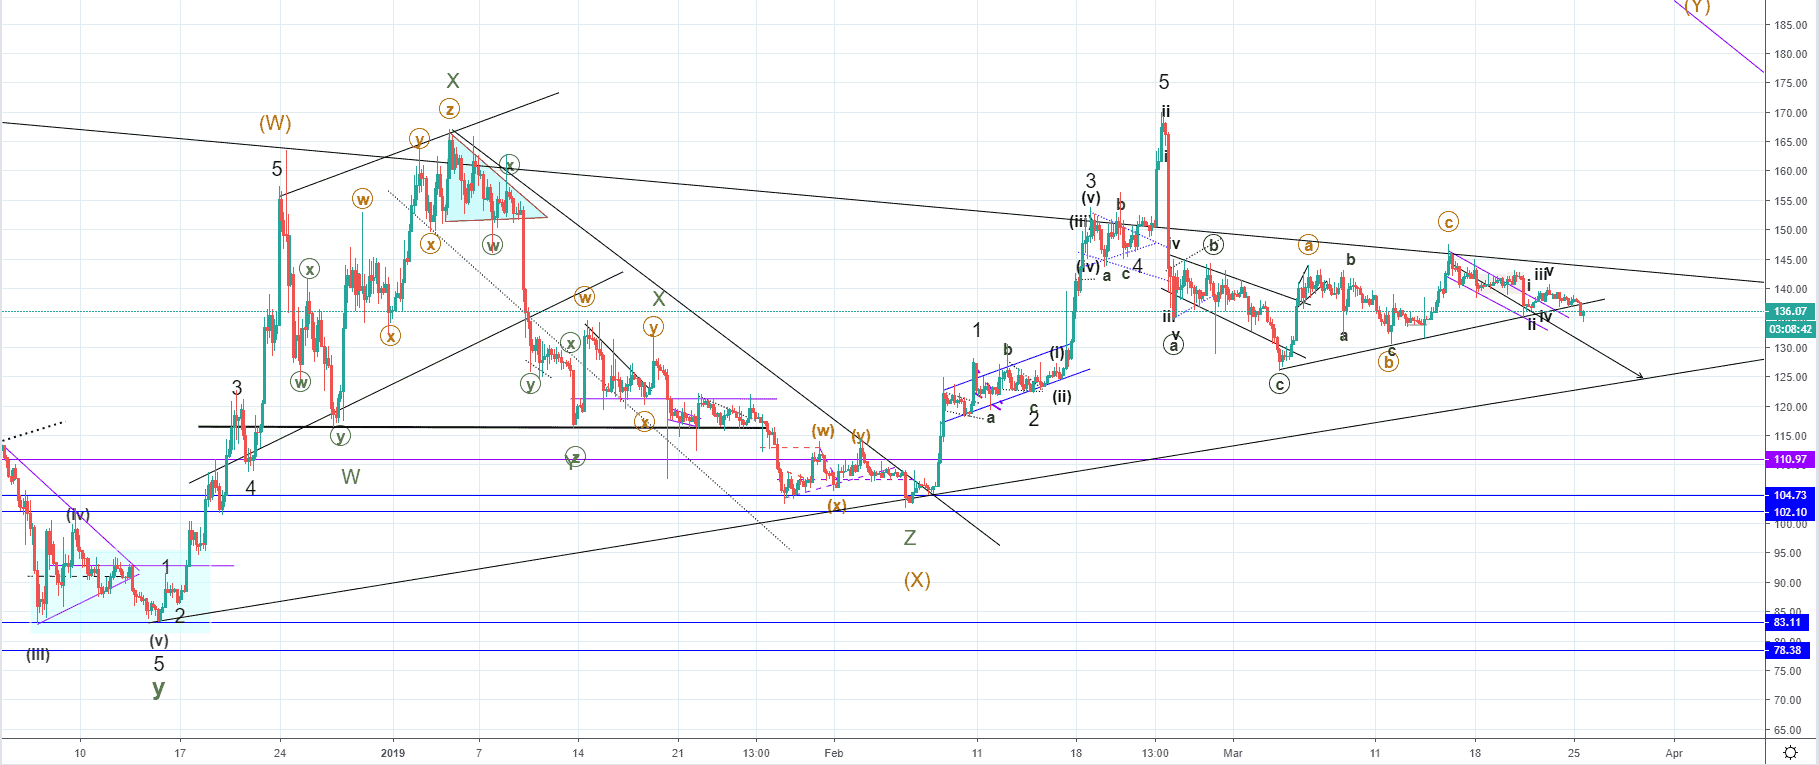
If the mentioned correction ended on the five-wave move to the upside reaching $170 at its highest point, from there the formed structure would be either the prolongation of the mentioned Intermediate correction or the start of the trend continuation.
The price of Ethereum fell by over 20% on the 24th of February which indicates impulsiveness but considering that after that decrease we have mostly been seeing corrective, choppy price action, it could very well be the second wave X.
In either way, as the price action formed two structures – a descending one and ascending, corrective one after the five-wave move to the upside ended, we are most likely seeing the start of the third structure to the downside.
From the depth of the downside movement and the momentum behind the decrease, we are to see which scenario would be validated.
Join Our Telegram channel to stay up to date on breaking news coverage