Join Our Telegram channel to stay up to date on breaking news coverage
The Solana price prediction reveals that SOL is a high-performance Layer-1 blockchain token known for its fast transaction speeds and low fees, making it a key player in the smart contract ecosystem.
Solana Prediction Data:
- Solana price now – $124.78
- Solana market cap – $69.73 billion
- Solana circulating supply – 562.65 million
- Solana total supply – 616.99 million
- Solana Coinmarketcap ranking – #7
Getting in early on strong crypto projects is often highlighted as a major advantage, and Solana is a clear example of how dramatic those long-term gains can be. From its all-time low of $0.5052 recorded on May 11, 2020, SOL has climbed by about +24061.53%, showing how far the asset has progressed from its earliest tracked downside. Even after setting an all-time high of $294.33 on January 19, 2025, it is still down about 58.53% from that peak, which keeps the market in a recovery and valuation reset phase. In the short term, today’s trading range between $119.57 and $124.93 reflects ongoing volatility, but the bigger picture remains that SOL has already delivered massive upside from its lowest historical levels.
SOL/USD Market
Key Levels:
Resistance levels: $155, $165, $175
Support levels: $95, $85, $75
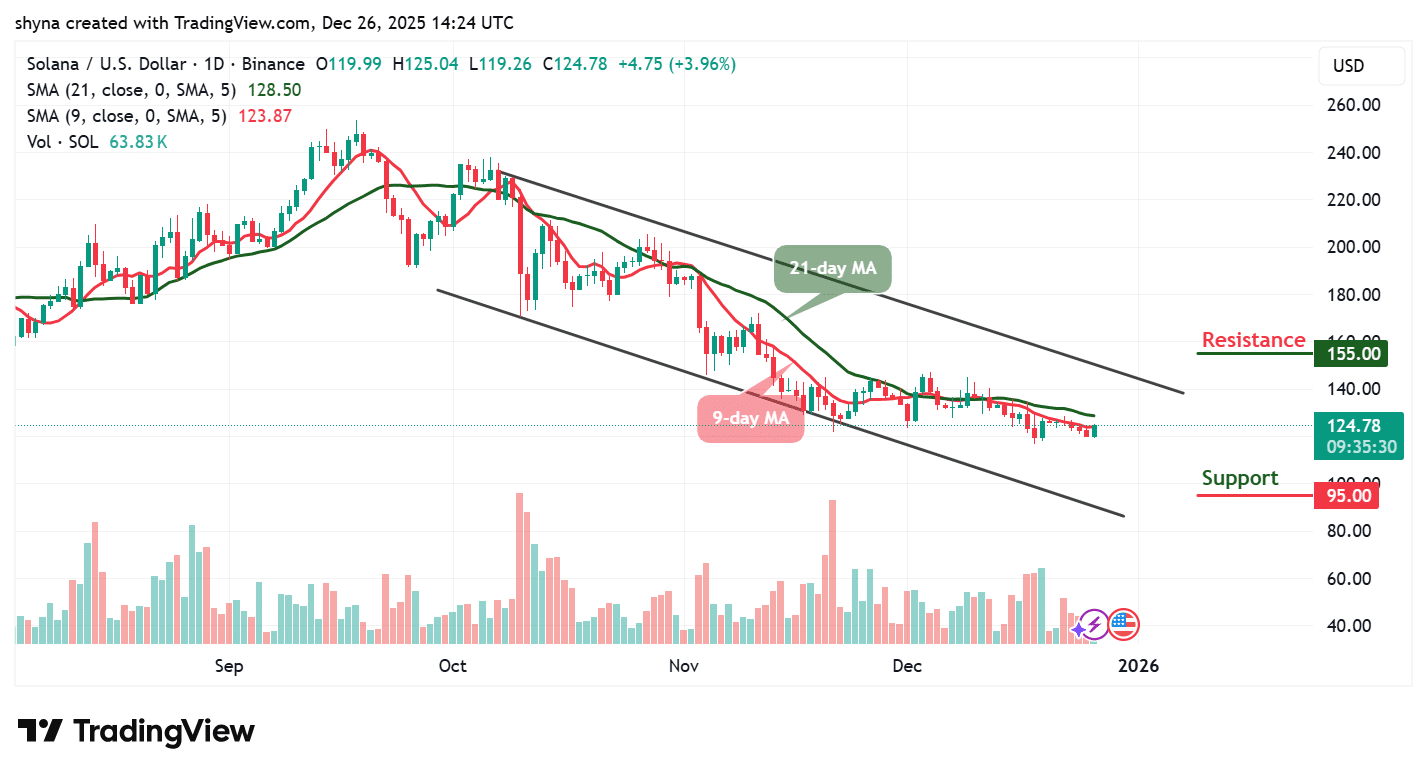
The daily chart shows that SOL/USD is trading firmly inside a descending channel, reflecting a broader corrective phase following its previous rally. Recent candles suggest a short-term relief bounce from the lower boundary of the channel, indicating that buyers are beginning to step in at key demand zones. Although the broader trend remains bearish, this reaction hints at early stabilization, especially as selling pressure appears to be moderating compared to earlier sessions.
Solana Price Prediction: Descending Channel Still Controls Price Action
From a technical perspective, the Solana price is attempting to build momentum near the mid-range of the descending channel. The 9-day moving average is starting to flatten, suggesting slowing downside momentum, while the 21-day moving average continues to cap upside attempts and act as dynamic resistance. A sustained move toward the upper half of the channel would increase the probability of a test of overhead resistance levels, where sellers are expected to become active again unless volume expands convincingly.
Critical Solana Update
If bullish momentum strengthens, the market could gradually push toward the first major resistance zone, followed by higher resistance levels that align with prior price reactions and the upper channel boundary. A daily close above these resistance areas would be a strong technical signal, potentially opening the door for a broader recovery phase and a shift from a bearish structure into a neutral or corrective bullish trend. On the downside, failure to maintain the current recovery could see SOL/USD roll over and revisit lower support levels. A decisive breakdown below the channel’s lower boundary would invalidate the short-term recovery attempt and expose the market to deeper losses toward successive support zones. For now, Solana remains at a technical crossroads, with price direction likely to be determined by how it reacts to the descending channel and the moving average resistance in the sessions ahead.
SOL/BTC Remains Bearish Within a Descending Channel
Solana against Bitcoin is currently trading within a clearly defined descending channel on the daily timeframe, indicating sustained bearish pressure. The market price is hovering around 0.0013 BTC with the last four digits at 3991 SAT, showing limited bullish follow-through despite a modest daily recovery. Price action remains below both the 9-day and 21-day moving averages, which continue to slope downward and act as dynamic resistance. As long as SOL/BTC stays beneath these moving averages, sellers are likely to maintain control, keeping the pair compressed toward the lower boundary of the channel. A failure to reclaim the moving averages could expose the price to a renewed test of the 0.0012 BTC support zone, which remains a critical level for short-term structure.
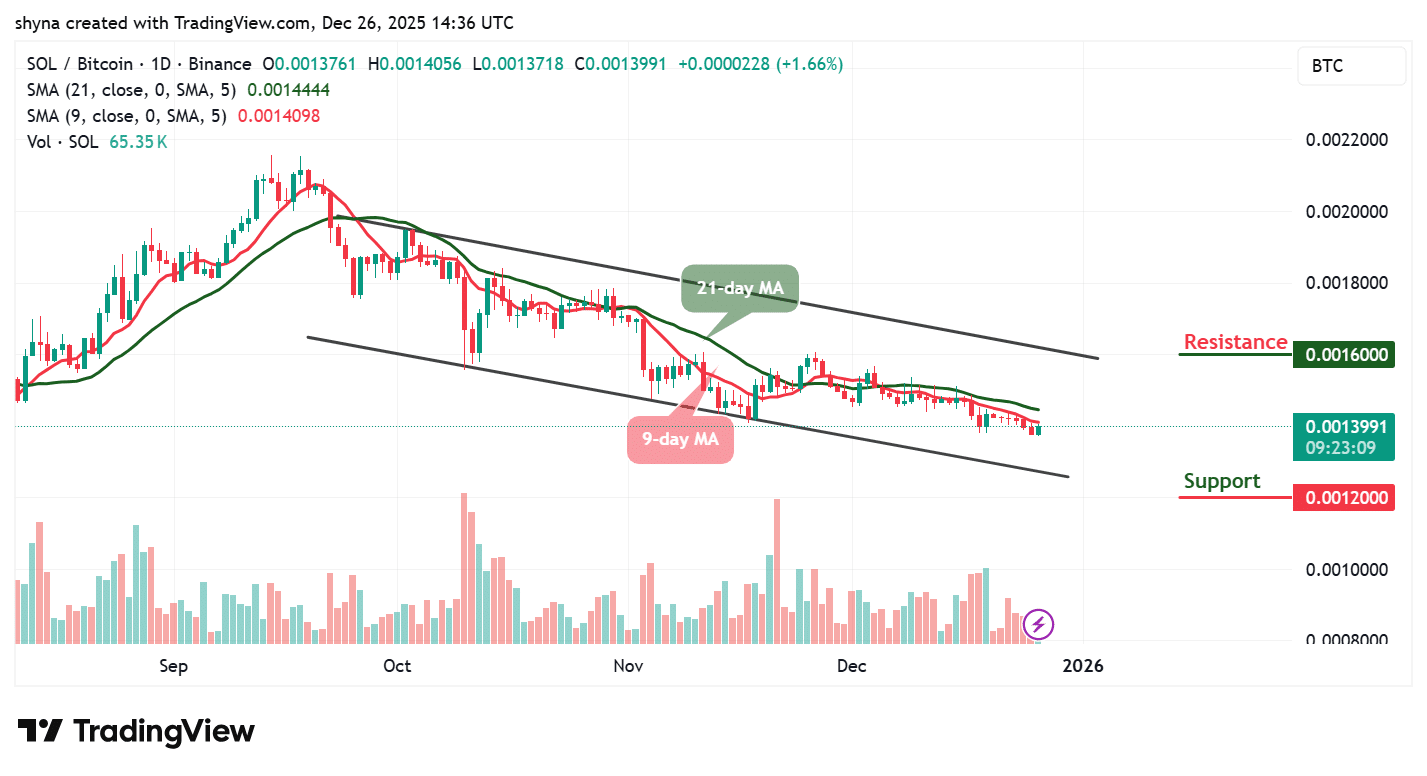
From a technical perspective, the broader outlook suggests that SOL/BTC is still vulnerable to further downside unless a clear breakout occurs. The immediate resistance is clustered around 0.0016 BTC, where the descending channel resistance and the 21-day moving average converge. A decisive close above this region could signal a short-term trend shift and open the door for a recovery toward higher resistance zones. However, if bearish momentum persists and the price breaks cleanly below 0.0012 BTC, the decline could accelerate as stop liquidity is triggered beneath support. Until a confirmed breakout occurs, the market bias remains cautiously bearish, with consolidation and gradual weakness favored over aggressive upside expansion.
On that note, the crypto analyst @DonWedge, who has over 228k followers on X, formerly Twitter, noted that $SOL appears to be quietly breaking out of a falling wedge pattern. According to his analysis, a reclaim of the $133 level is the first key target, which could then attract the price toward $206, with $300 acting as a longer-term magnet. Overall, the setup suggests the potential for a very strong upside move.
$SOL is low key breaking out from the falling wedge pattern $133 is the reclaim target and then $206 should magnet followed by $300
I am expecting a really strong move tbh pic.twitter.com/1F4tisj0g6
— Don 🐂 (@DonWedge) December 25, 2025
Nonetheless, the recent price action suggests that Solana is approaching a critical turning point where competing technical signals are beginning to converge. The above analyst’s breakout outlook aligns with the daily chart structure, which shows SOL still trading within a descending channel but exhibiting signs of stabilization and waning selling pressure. Meanwhile, the short-term rebound from key demand zones and the flattening of short-term moving averages support the idea of an emerging bullish shift, consistent with a falling wedge breakout narrative. However, the broader trend has not fully flipped, as dynamic resistance and the upper boundary of the channel remain significant barriers. A sustained advance supported by strong volume would be needed to confirm a bullish transition, while failure to maintain momentum could see the market resume its corrective decline.
Related News
- Solana Price Soars 4% Even As Glassnode Warns SOL Liquidity Sits At ‘Deep Bear Market’ Level
- Solana Price Climbs 1% As Solana Mobile Confirms SKR Token Launch With 30% Airdrop
Best Wallet - Diversify Your Crypto Portfolio

- Easy to Use, Feature-Driven Crypto Wallet
- Get Early Access to Upcoming Token ICOs
- Multi-Chain, Multi-Wallet, Non-Custodial
- Now On App Store, Google Play
- 250,000+ Monthly Active Users
Join Our Telegram channel to stay up to date on breaking news coverage