Join Our Telegram channel to stay up to date on breaking news coverage
The Hedera price prediction shows that HBAR continues to trade under bearish pressure, with its price movement confined within a descending channel on the daily timeframe.
Hedera Prediction Data:
- Hedera price now – $0.157
- Hedera market cap – $6.69 billion
- Hedera circulating supply – 42.47 billion
- Hedera total supply – 50 billion
- Hedera Coinmarketcap ranking – #20
Getting involved early in strong crypto projects is often where the biggest gains are found, and Hedera’s HBAR is a great example of how early positioning can pay off over time. Since its all-time low of $0.01001 on January 2, 2020, HBAR has soared by roughly +1472%, showing how dramatically early accumulation can outperform later entries. Even though the price currently trades far below its 2021 all-time high of $0.5701, recent 24-hour action between $0.1512 and $0.1612 highlights how investors continue to monitor key levels as the market cycles evolve.
HBAR/USD Market
Key Levels:
Resistance levels: $0.190, $0.200, $0.210
Support levels: $0.125, $0.115, $0.105
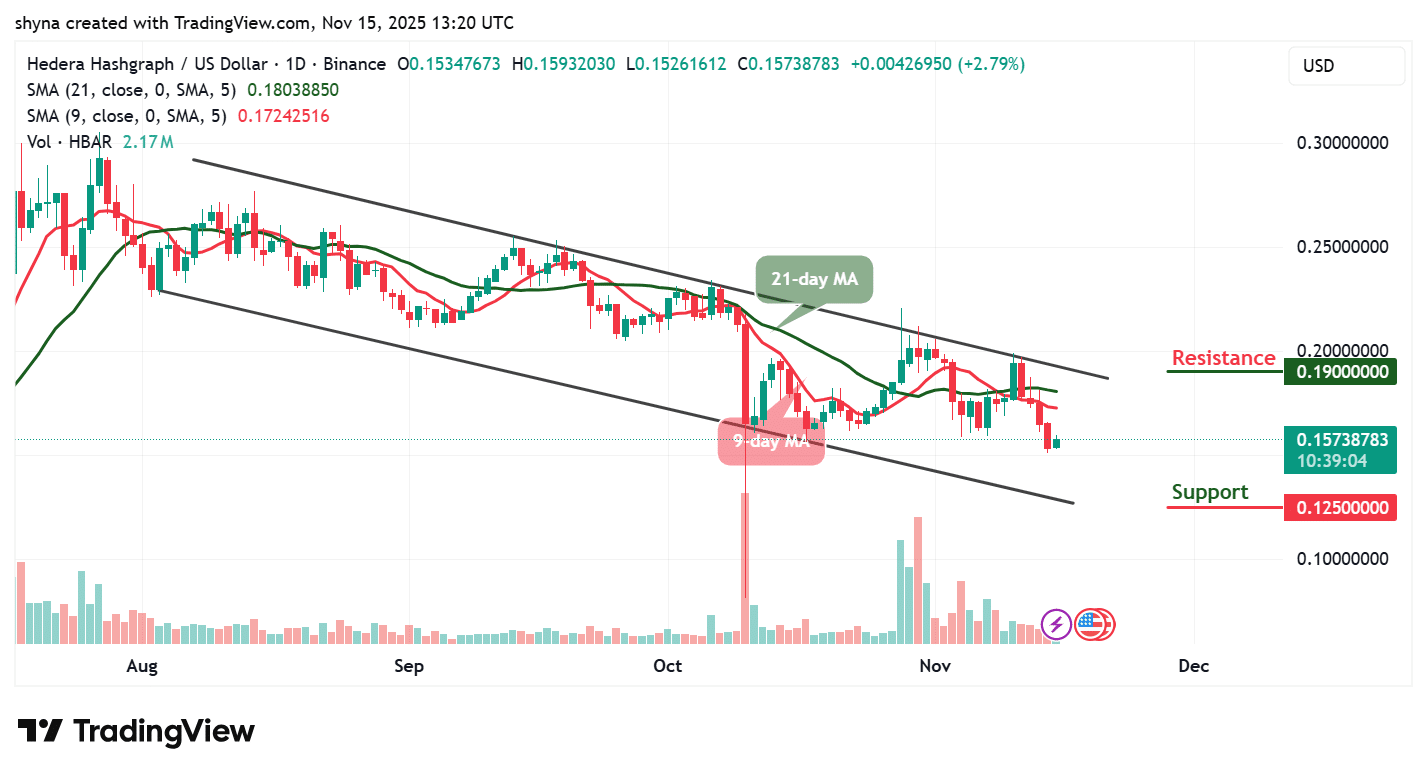
HBAR/USD is currently hovering around a key support zone after experiencing sustained downside movement within its channel structure. The price remains below both the 9-day and 21-day moving averages, a sign that sellers continue to dictate short-term market direction. If Hedera (HBAR) stays pressured at these levels, the next logical move could be a retest of the $0.125 support region, which has acted as a critical buffer in previous declines. A decisive candle close below this threshold may strengthen bearish sentiment further.
Hedera Price Prediction: HBAR Tests Critical Support Levels
Technically, the descending channel suggests that Hedera (HBAR) is still in a broader downtrend, with lower highs and lower lows defining its structure. For the bulls to regain control, the price must break above the 9-day MA and then challenge the 21-day MA, which currently aligns with the $0.17–$0.18 zone. A breakout above this cluster could set the stage for a test of the $0.190 resistance level. However, without increased buying volume, HBAR/USD may continue drifting within the channel, exposing it to deeper support areas at $0.115 and $0.105 if selling intensifies.
Urgent HBAR Warning | Hedera HBAR Price Prediction 2025
Despite the bearish conditions, the current price area does align with a historical demand zone where buyers have previously stepped in. A strong rebound from this level could signal a temporary relief rally, potentially driving Hedera back toward the mid-channel resistance. Still, the market would need sustained bullish momentum to shift the broader trend and open a path toward $ 0.20 and $ 0.21. Nevertheless, HBAR/USD remains at a crossroads as it battles key support within a downtrending structure. Buyers will need to defend the $0.125 level to prevent further price deterioration, while sellers aim to push deeper into the lower channel. Traders should closely monitor volume, as a notable increase could provide early clues on whether HBAR is preparing for a reversal or another leg down.
HBAR/BTC Market Outlook – Trend Pressure and Next Key Levels
HBAR/BTC is still trading within a clear descending channel on the daily chart, showing persistent bearish pressure as price continues to respect lower highs and lower lows. The market is currently sitting around 0.00000165 BTC (165 SAT), slightly below the 9-day and 21-day moving averages, which reinforces the ongoing downward sentiment. Unless buyers step in with strong volume, the pair risks sliding back toward the mid-channel and eventually retesting the crucial support at 0.00000135 BTC (135 SAT). A candle close below this support would signal renewed bearish momentum, placing the lower boundary of the descending channel back in play and opening the door to deeper downside movement.
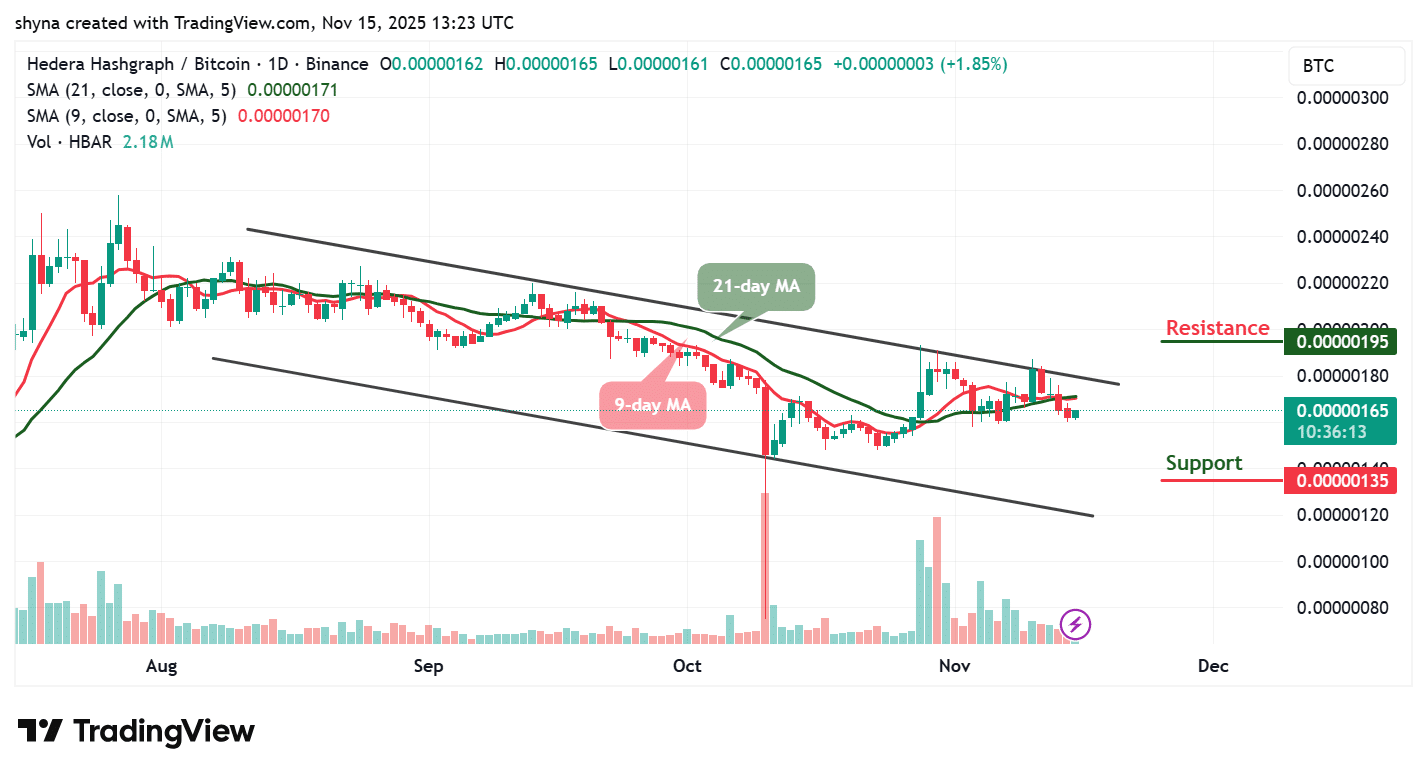
Despite the bearish trend, there is still room for a bullish reaction if buyers manage to defend the current zone. If HBAR/BTC manages to reclaim the shorter moving average and break above the upper trendline, the next notable upside target sits at 0.00000195 BTC (195 SAT), which aligns with the nearest daily resistance. A breakout above this level would mark a meaningful shift in structure, potentially signaling the start of a trend reversal. However, the bulls must maintain sustained pressure and close consistently above both moving averages to confirm a breakout from the downward channel.
Meanwhile, on X (formerly Twitter), @Cosmideus told his followers that he expects $HBAR to dip below $0.10, but he questioned whether traders will actually have the courage to accumulate at such a level. He suggested that many might hesitate and miss what could be the final major accumulation opportunity before a potential long-term climb—one he believes could take HBAR toward $7 by 2027, if the broader market aligns with that outlook.
$HBAR will go under .10, but will you even have the courage to buy when it does? or will you miss out the last chance to back the truck up at that level before we head to $7 by 2027? pic.twitter.com/KJ8ONBd0H9
— COSMIC (@Cosmideus) November 13, 2025
While @Cosmideus frames the ongoing weakness in HBAR as a potential gift, arguing that a dip below $0.10 could be the last major buying opportunity before an ambitious long-term climb toward $7, the technical outlook remains more grounded in immediate price behavior. Current market structure shows HBAR trading below its 9-day and 21-day moving averages and clinging to a key support zone, signaling that sellers still control momentum. If the pressure persists, a move toward the $0.125 support level appears likely, and a breakdown beneath it could deepen bearish sentiment. In contrast to the analyst’s high-conviction future projection, the chart simply reflects ongoing short-term vulnerability.
Related News
- Hedera Price Prediction: HBAR Surges 13% After Robinhood Listing, But Traders Flock To This Trading Bot ICO For 100x Gains
- Hedera Price Prediction: HBAR Soars 25% As This Telegram Trading Bot Token Closes On $2 Million In Presale
Best Wallet - Diversify Your Crypto Portfolio

- Easy to Use, Feature-Driven Crypto Wallet
- Get Early Access to Upcoming Token ICOs
- Multi-Chain, Multi-Wallet, Non-Custodial
- Now On App Store, Google Play
- 250,000+ Monthly Active Users
Join Our Telegram channel to stay up to date on breaking news coverage