Join Our Telegram channel to stay up to date on breaking news coverage
The ApeCoin price prediction reveals that APE continues to trade under heavy bearish pressure as sellers dominate the broader market. The token, once known for strong speculative surges, is now struggling to maintain upward momentum as it trends within a descending channel.
ApeCoin Prediction Data:
- ApeCoin price now – $0.35
- ApeCoin market cap – $265.64 million
- ApeCoin circulating supply – 752.65 million
- ApeCoin total supply – 1 billion
- ApeCoin Coinmarketcap ranking – #149
In crypto, it’s often said that being early can make all the difference, and ApeCoin (APE) is a clear example of how timing shapes outcomes. After launching in March 2022, APE skyrocketed to its all-time high of $39.40, a level that now sits about 99% below today’s price range, showing how dramatically early momentum can fade. Yet the flip side is just as striking: from its all-time low of $0.1624 reached only a month ago, APE has already climbed more than 117%, proving that even after severe declines, strong rebounds can emerge. This kind of extreme price movement highlights why early positioning and understanding market cycles remain a key principle for crypto investors.
APE/USD Market
Key Levels:
Resistance levels: $0.45, $0.50, $0.55
Support levels: $0.25, $0.20, $0.15

APE/USD remains in a prolonged downtrend, with the price consistently trading below both the 9-day and 21-day moving averages. The chart shows a clear descending channel stretching from late September, signaling persistent bearish sentiment. The recent daily candle around $0.35 attempts to stabilize, but the overall structure shows that buyers are lacking the strength to reverse the current trend. ApeCoin has been losing value gradually as each relief rally gets rejected near the channel’s upper boundary.
ApeCoin Price Prediction: What Could Be the Next Move for APE?
Currently, APE/USD is sitting slightly above mid-channel support, but downside pressure remains strong. The next critical support lies at $0.25, followed by deeper support levels at $0.20 and $0.15 if the bearish momentum accelerates. The 9-day moving average continues to act as a dynamic resistance line, rejecting every attempt to reclaim the short-term trend. Unless buyers push the price above $0.40, the bearish structure of lower highs and lower lows will continue.
ApeCoin – The Next Big Thing In 2025
However, momentum indicators still favor a bearish continuation. The downward-sloping 21-day moving average confirms a lack of sustained buying activity, while the descending channel suggests the market may drift lower toward support before any meaningful recovery. A break below $0.30 in the coming days could expose the market to a retest of the lower boundary around $0.25, which aligns with a key long-term demand zone.
Meanwhile, for ApeCoin to break out of this bearish cycle, the price would need to reclaim the 9-day MA and push toward the $0.45 resistance level. A close above this resistance could trigger a short-term bullish reversal, potentially targeting higher resistance zones at $0.50 and $0.55. However, without a strong catalyst, such as increased utility, renewed investor sentiment, or a broader crypto market upswing, APE/USD may continue to trade sideways or drift lower within the channel.
Moreover, ApeCoin’s outlook for the short term remains bearish to neutral, with sellers maintaining control. A bounce from $0.25 could introduce temporary recovery, but the broader trend favors further consolidation and potential declines unless buyers step in with strong volume.
APE/BTC Market Outlook – Bearish Pressure Persists Below Key Levels
APE/BTC continues to trade inside a well-defined descending channel, indicating that sellers remain firmly in control of the market structure. The price currently sits around 0.0000371 BTC (371 SAT), struggling to break above the 9-day and 21-day moving averages, both of which are acting as dynamic resistance. Each attempt to push higher has been rejected near the mid-channel zone, suggesting weakening bullish momentum. If APE/BTC fails to clear the short-term resistance cluster between 0.0000400 BTC (400 SAT) and 0.0000450 BTC (450 SAT), the pair may continue drifting lower as the broader trend aligns with consistent lower highs and lower lows.
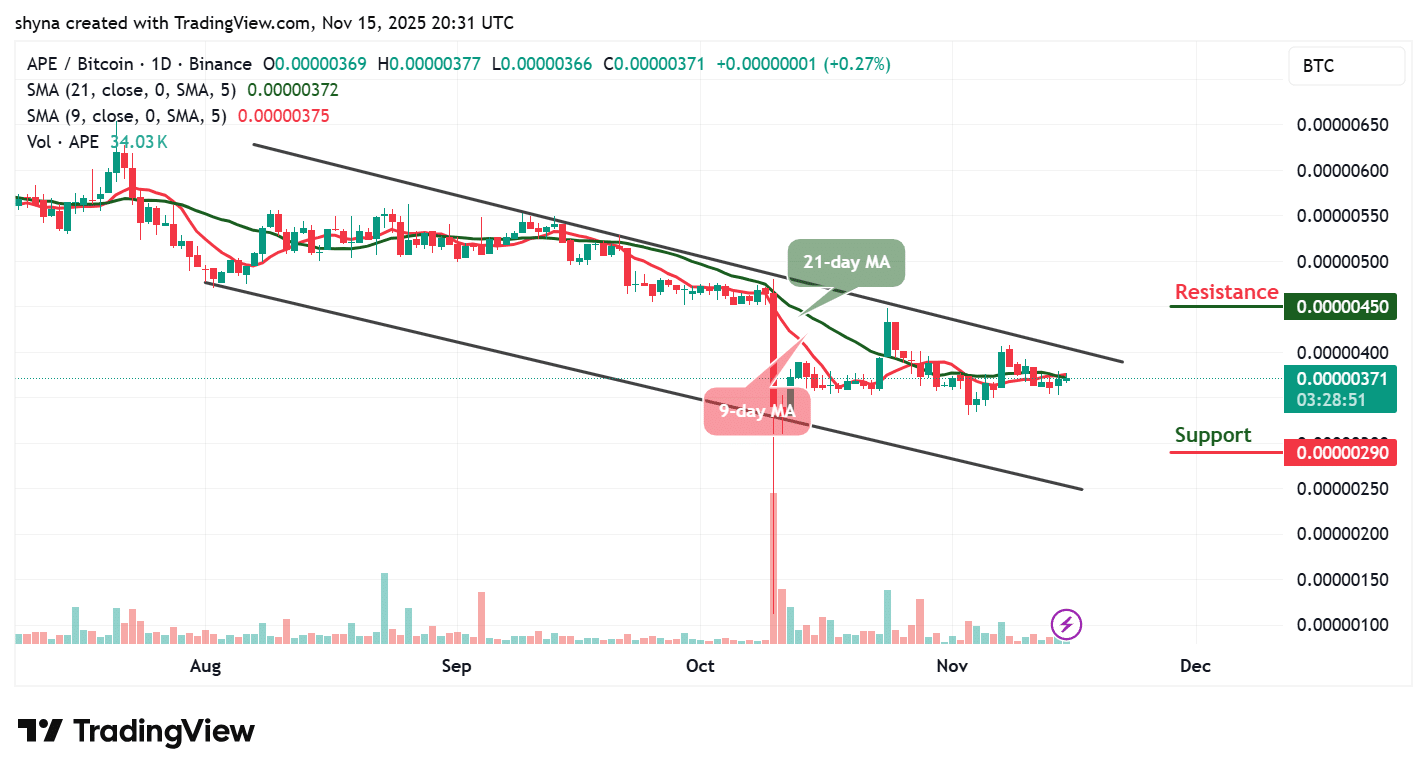
At the same time, downside risk remains elevated as the pair moves closer to the lower boundary of the descending channel. A decisive breakdown beneath 0.0000320 BTC (320 SAT) would likely accelerate a decline toward the major support level at 0.0000290 BTC (290 SAT), where buyers may attempt to stabilize price action. However, unless APE/BTC prints a strong bullish reversal candle and breaks above the 21-day MA with volume confirmation, the market outlook remains bearish-to-neutral. Overall, the chart suggests that APE/BTC is more likely to retest lower support levels before any meaningful recovery attempt.
On X (formerly Twitter), @Umairorkz, who has over 26k followers, noted that APE’s drop from $0.39 back into the $0.34–0.35 zone unfolded exactly as expected, with the 13% rejection perfectly matching the market structure he previously outlined. Although the chart now shows an attempt at a momentum shift, there is still no convincing evidence of a true trend reversal, especially with volume remaining weak and inconsistent. APE is currently trying to break above the RSI trendline and reclaim the recent value-area low, with the first key hurdle being the underside of the former bull-flag trendline. Beyond that, the next major resistance lies again at $0.39, and while a short-term 6–8% bounce is possible, it depends heavily on a volume boost that has yet to appear.
$APE
The drop from $0.39 back into the $0.34–0.35 zone played out cleanly, the 13% rejection was textbook given the structure, so no surprises there as it was called for in the last update. Now the chart is showing an attempted momentum shift, but nothing here screams “trend… https://t.co/fXTlAneXRT pic.twitter.com/NlqTytZKEo— Umair Crypto (@Umairorkz) November 14, 2025
The above analyst’s perspective, pointing to a clean rejection from $0.39, weak volume, and no convincing signs of reversal, lines up closely with this broader technical outlook that highlights APE/USD’s persistent downtrend beneath both key moving averages. While the first analysis notes a possible short-term bounce if volume improves, the current breakdown reinforces the same underlying message: ApeCoin remains trapped in a descending channel, buyers are too weak to shift momentum, and every rally continues to fail near structural resistance. With critical support levels sitting far below and the $0.40 region acting as a major barrier, both analyses ultimately conclude that APE’s upside potential is limited unless a significant surge in demand disrupts the prevailing bearish pattern.
Related News
- ApeCoin Price Prediction: As APE Plunges 15%, This Innovative Staking Meme Coin ICO Charges Towards $3 Million
- Is It Too Late To Buy APE? ApeCoin Price Surges 50% and This Might Be the Next Crypto to Explode
Best Wallet - Diversify Your Crypto Portfolio

- Easy to Use, Feature-Driven Crypto Wallet
- Get Early Access to Upcoming Token ICOs
- Multi-Chain, Multi-Wallet, Non-Custodial
- Now On App Store, Google Play
- 250,000+ Monthly Active Users
Join Our Telegram channel to stay up to date on breaking news coverage