Join Our Telegram channel to stay up to date on breaking news coverage
The XRP price slid 8% in the last 24 hours to trade at $2.29 as of 3.35 a.m. EST on a 32% surge in trading volume to $7.7 billion.
This comes even after the Canary XRP ETF (XRPC) recorded first-day trading volume of $58 million, beating all other ETF launches this year. That topped the previous best $57 million trading volume recorded by Bitwise Solana Staking ETF (BSOL).
XRPC also attracted $245 million in inflows on its first day, with Canary Capital CEO Steven McClurg suggesting the reason for such high inflows was pent-up demand to get regulated exposure to XRP.
Congrats to $XRPC for $58m in Day One volume, the most of any ETF launched this year (out of 900), BARELY edging out $BSOL's $57m. The two of them are in league of own tho as 3rd place is over $20m away. pic.twitter.com/MjsOeceeNb
— Eric Balchunas (@EricBalchunas) November 13, 2025
XRP Price Faces Downside Pressure as Critical Support Holds $2.25–$2.30
XRP is currently trading at $2.2888, slightly down by 1.45%, as it tests a critical support zone around $2.25–$2.30. This area has acted as a key pivot in the past, providing a floor for price action multiple times over the last several months. A strong bounce from this zone could attract buyers and help stabilize the price, while a decisive break below it may open the way toward the $1.60–$1.50 levels, which align with the 0.618 Fibonacci retracement.
The short-term trend appears bearish, as XRP remains below both the 50-day and 200-day simple moving averages (SMA). The 50-day SMA is at $2.5599, below the 200-day SMA at $2.6312, forming a subtle bearish crossover signal. This indicates that short-term momentum is weaker than long-term trends, and unless buyers step in aggressively, XRP may continue to face selling pressure.
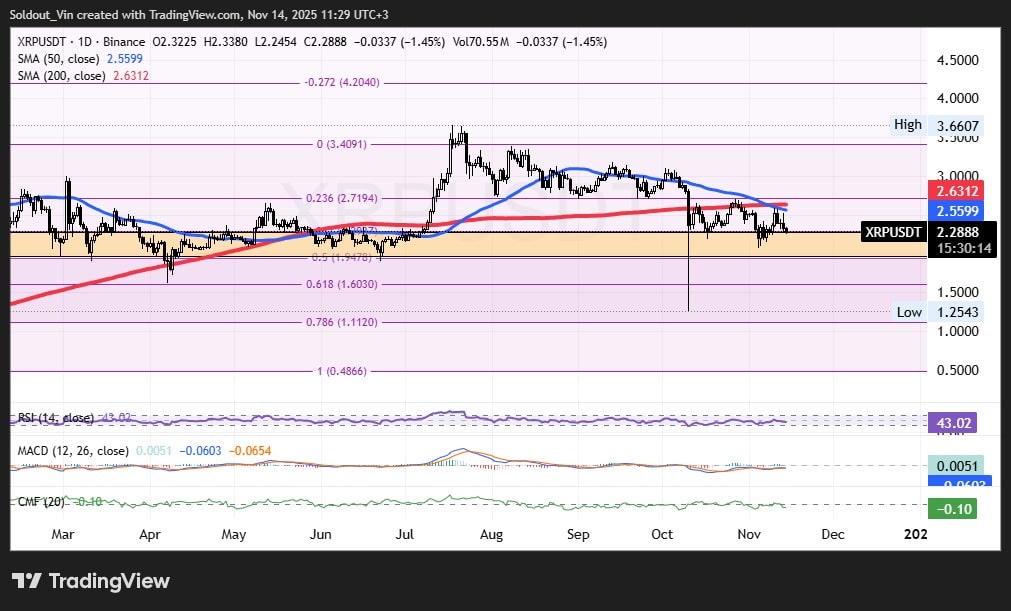
XRPUSDT Analysis Source: Tradingview
The Relative Strength Index (RSI) is at 43.02, below the neutral 50 level, signaling mild bearish momentum, although it is not yet in oversold territory. This implies that there is still room for further downside before any reversal signals may appear. The MACD shows a slight negative divergence, with the MACD line positioned below the signal line, confirming weakening momentum and the potential continuation of downward pressure.
The Chaikin Money Flow (CMF) is currently at -0.10, indicating that funds are flowing out of XRP and that selling pressure dominates buying activity. Traders should watch for a turn in the CMF toward positive territory, which could indicate renewed accumulation and a potential rebound in price.
Immediate resistance is seen at the 50-day SMA of $2.56 and the 200-day SMA of $2.63. A break above these levels could shift momentum to bullish territory and potentially target $2.72 and the previous high around $3.40. On the downside, failure to hold the current support may push XRP toward the $1.60–$1.50 zone.
XRP remains under pressure while testing a crucial support level. Indicators suggest weak momentum and an outflow of funds, so traders should exercise caution. Monitoring whether XRP can hold support or break lower will be key for short-term trading decisions.
Related Articles:
- UNI Soars 28% As Governance Overhaul Promises Token Burn
- Gemini Shares Hit Record Low After $160M Loss
- CleanSpark Shares Plunge 6.5% After Upsizing Convertible Bond
Best Wallet - Diversify Your Crypto Portfolio

- Easy to Use, Feature-Driven Crypto Wallet
- Get Early Access to Upcoming Token ICOs
- Multi-Chain, Multi-Wallet, Non-Custodial
- Now On App Store, Google Play
- Stake To Earn Native Token $BEST
- 250,000+ Monthly Active Users
Join Our Telegram channel to stay up to date on breaking news coverage