Join Our Telegram channel to stay up to date on breaking news coverage
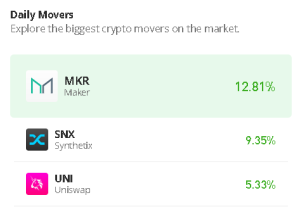
The Uniswap price prediction may not be stopped as the bulls aim to push the coin above the channel to hit the resistance level of $7.0.
Uniswap Prediction Statistics Data:
- Uniswap price now – $6.21
- Uniswap market cap – $3.5 million
- Uniswap circulating supply – 577.5 million
- Uniswap total supply – 1 billion
- Uniswap Coinmarketcap ranking – #24
UNI/USD Market
Key Levels:
Resistance levels: $7.30, $7.50, $7.70
Support levels: $5.00, $4.80, $4.60
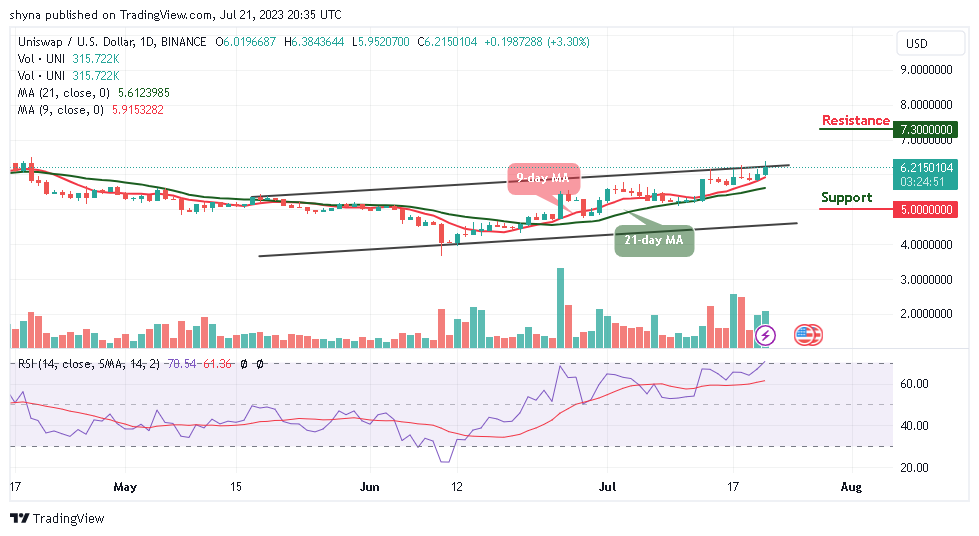
UNI/USD is now trading close to $6.50 as it hovers around the $6.21 resistance level at the time of writing. The Uniswap (UNI) may continue to move upwards if the price crosses above the upper boundary of the channel. Meanwhile, UNI/USD may touch the resistance level of $6.50 if the bulls focus on the upward trend.
Uniswap Price Prediction: What to Expect from UNI/USD
The Uniswap price may remain on the positive side above the 9-day and 21-day moving averages. However, the technical indicator Relative Strength Index (14) is seen moving to cross above the overbought region, therefore, there is a higher chance that the coin may likely find the potential resistance levels at $7.30, $7.50, and $7.70. On the contrary, any bearish movement below the 9-day and 21-day moving averages may locate the critical supports at $5.00, $4.80, and $4.60 respectively.
Against Bitcoin, UNI price has also been following the uptrend, hovering above the 9-day and 21-day moving averages. The nearest resistance level may surface above the upper boundary of the channel at 2100 SAT and may then locate a potential resistance level at 230 SAT and above if the buying pressure becomes huge.

Meanwhile, on the downside, the Uniswap pair could face support at 1900 SAT. Below the 9-day and 21-day moving averages lies the major support at 1800 SAT and below. However, the cryptocurrency may continue to follow the bullish movement as the technical indicator Relative Strength Index (14) crosses above the 70-level. Therefore, if the signal line breaks below this level, traders can expect bearish pressure below the 9-day moving average.
Uniswap Alternatives
The Uniswap price begins a fresh increase as the price continues to rise above the 9-day and 21-day moving averages; it is likely for the crypto to accelerate higher if it breaks above the upper boundary of the channel.
On that note, Investors have a limited opportunity to buy Wall Street Memes ($WSM) tokens at a discounted price during the presale. This is a way to compound gains in $WSM and potentially achieve millionaire status. However, since the launching of the presale, the token has raised almost $17m so far.
New OKX Listing - Wall Street Memes

- Established Community of Stocks & Crypto Traders
- Featured on Cointelegraph, CoinMarketCap, Yahoo Finance
- Rated Best Crypto to Buy Now In Meme Coin Sector
- Team Behind OpenSea NFT Collection - Wall St Bulls
- Tweets Replied to by Elon Musk
Join Our Telegram channel to stay up to date on breaking news coverage