Join Our Telegram channel to stay up to date on breaking news coverage
The Polkadot price prediction could break below the $9 support if the price fails to cross above the moving averages.
Polkadot Prediction Statistics Data:
- Polkadot price now – $10.37
- Polkadot market cap – $10.2 billion
- Polkadot circulating supply – 987.5 million
- Polkadot total supply – 1.1 million
- Polkadot Coinmarketcap ranking – #11
DOT/USD Market
Key Levels:
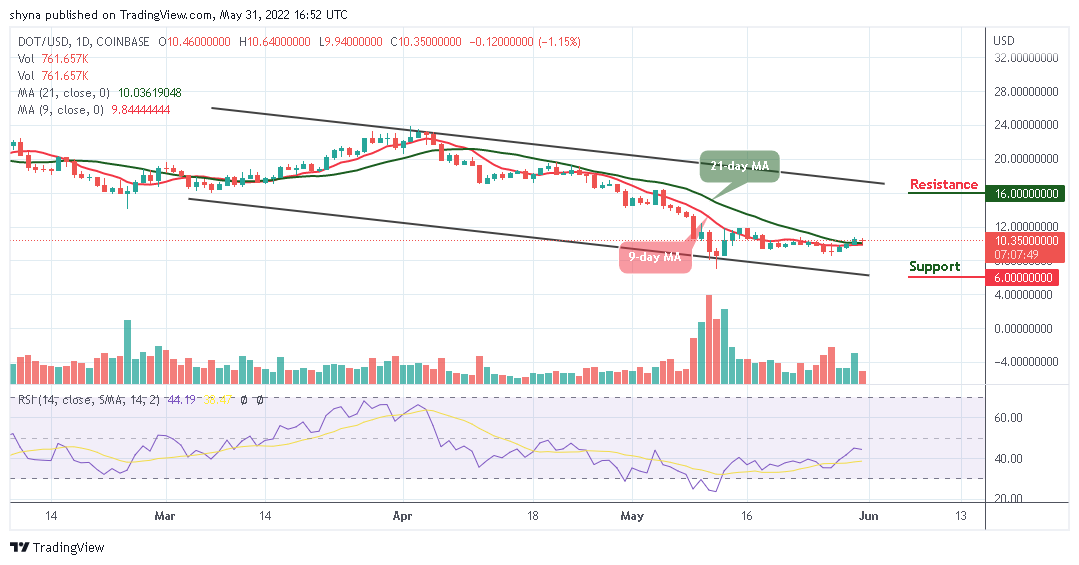
Resistance levels: $16, $17, $18
Support levels: $6, $5, $4
DOT/USD is yet to break above the resistance level of $12 as the coin trades around the 9-day and 21-day moving averages due to the renewed bearish momentum emanating from the rejection around $10.6. However, Polkadot (DOT) price is currently trading with a 1.15% loss, and the value remains below the average within the market.
Polkadot Price Prediction: Polkadot Price May Delay Its Uptrend
The Polkadot price may continue to consolidate in a flag formation as the coin may head towards the south. Nonetheless, the daily breakdown reveals that DOT/USD may delay its uptrend as long as the 9-day MA remains below the 21-day MA. Whereas, if the support level of $10 gets weak, a price break-down may occur as the bears may find new lows at $6, $5, and $4 support levels.
On the other hand, a bullish movement towards the upper boundary of the channel may push the market to the nearest resistance level of $15 before touching the potential resistance levels at $16, $17, and $18. At the moment, the technical indicator Relative Strength Index (14) is moving below the 50-level, which could keep the coin at the downside.
When compared with Bitcoin, the recent sideways movement in the market is due to the price stability in the market and what the traders need to note here is that the market is preparing to change the trend and a short-term bearish breakout is most likely to play out because the technical indicator Relative Strength Index (14) is likely to cross below 40-level and this could find the nearest support level at 2600 SAT and below.
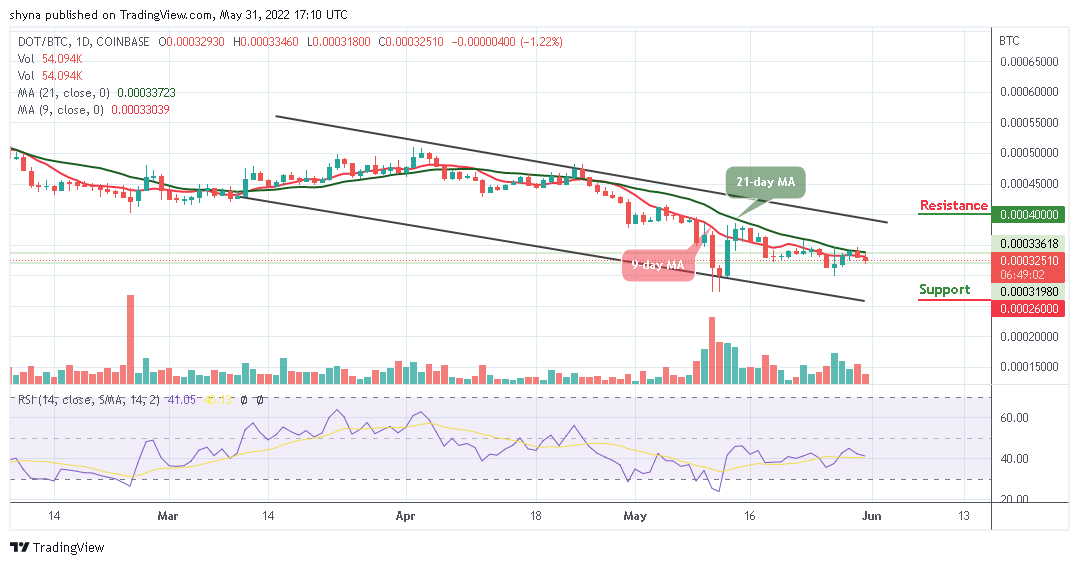
However, the only condition for the resumption of the bullish trend is if the 3100 SAT can provide support for the market, then the price may be able to cross above the 9-day and 21-day moving averages before touching the resistance level of 4000 SAT and above. Meanwhile, the Polkadot price may continue to follow the sideways movement if the signal line of the technical indicator RSI (14) moves in the same direction.
Read more:
- How to buy cryptocurrency
Join Our Telegram channel to stay up to date on breaking news coverage