Join Our Telegram channel to stay up to date on breaking news coverage
The Polkadot price prediction is likely to show an upward trend if the market can stay above the moving averages.
Polkadot Prediction Statistics Data:
- Polkadot price now – $7.19
- Polkadot market cap – $8.8 billion
- Polkadot circulating supply – 1.25 billion
- Polkadot total supply – 1.38 billion
- Polkadot CoinMarketCap ranking – #12
DOT/USD Market
Key Levels:
Resistance levels: $8.5, $9.0, $9.5
Support levels: $5.5, $5.0, $4.5

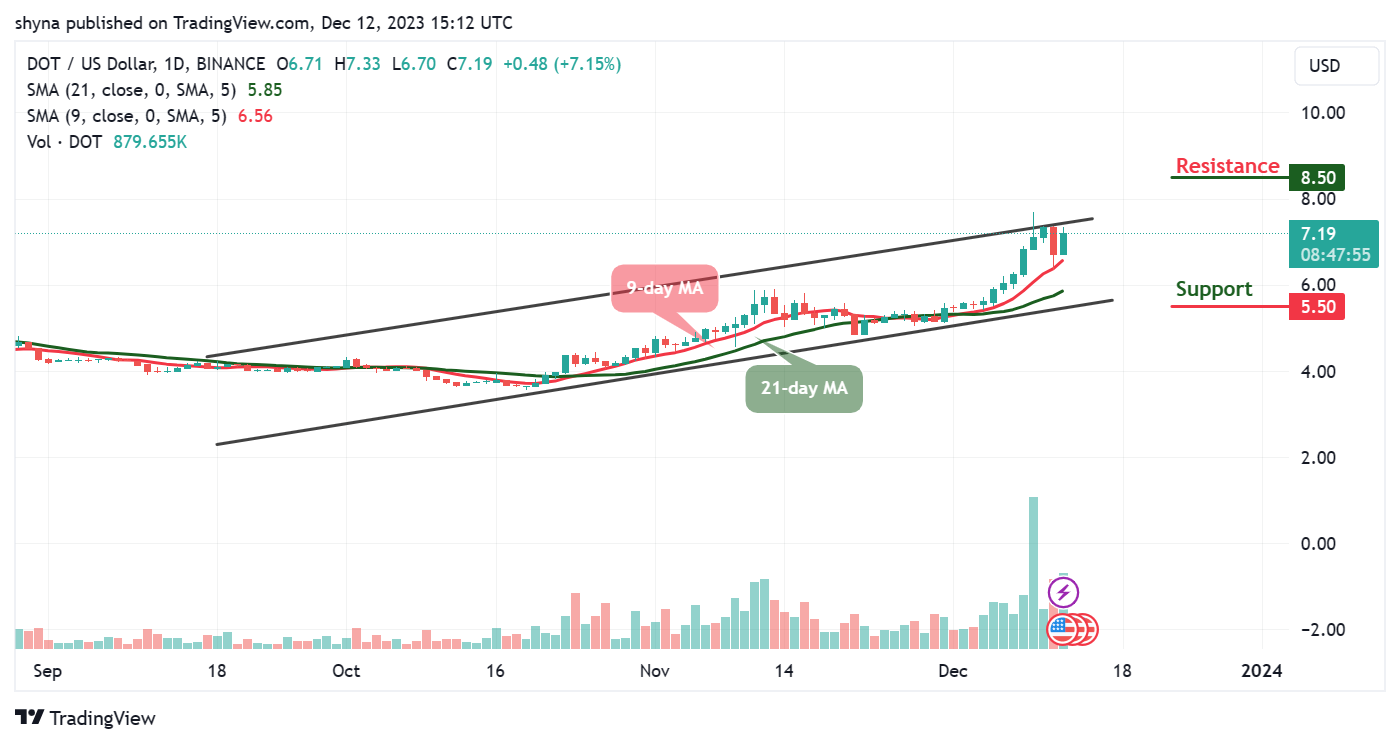
At the time of writing, DOT/USD is showing a positive movement as the market opens today. The market is running a little retracement move with a price growth of 7.15%. Aside from today’s little gain, the Polkadot price is still maintaining a bullish movement within the channel and traders can expect the coin to spike above the upper boundary of the channel as soon as the bulls put more pressure on the market.
Polkadot Price Prediction: DOT/USD May Stay Above at the Upside
If the Polkadot price continues to follow the upward movement, traders can expect a bullish continuation if the buyers increase the pressure. However, as the 9-day MA keeps hovering above the 21-day MA; the potential resistance levels could be located at $8.5, $9.0, and $9.5 in the long term.
Meanwhile, if the coin begins to move sideways, the market price may either break above the channel or head to the south. Looking at the price formation, a bullish movement may continue to play out for this market but any bearish cross below the lower boundary of the channel could roll the coin back to the long-term support at $5.5, $5.0, and $ 4.5 levels.
DOT/BTC Bulls Could Play Out
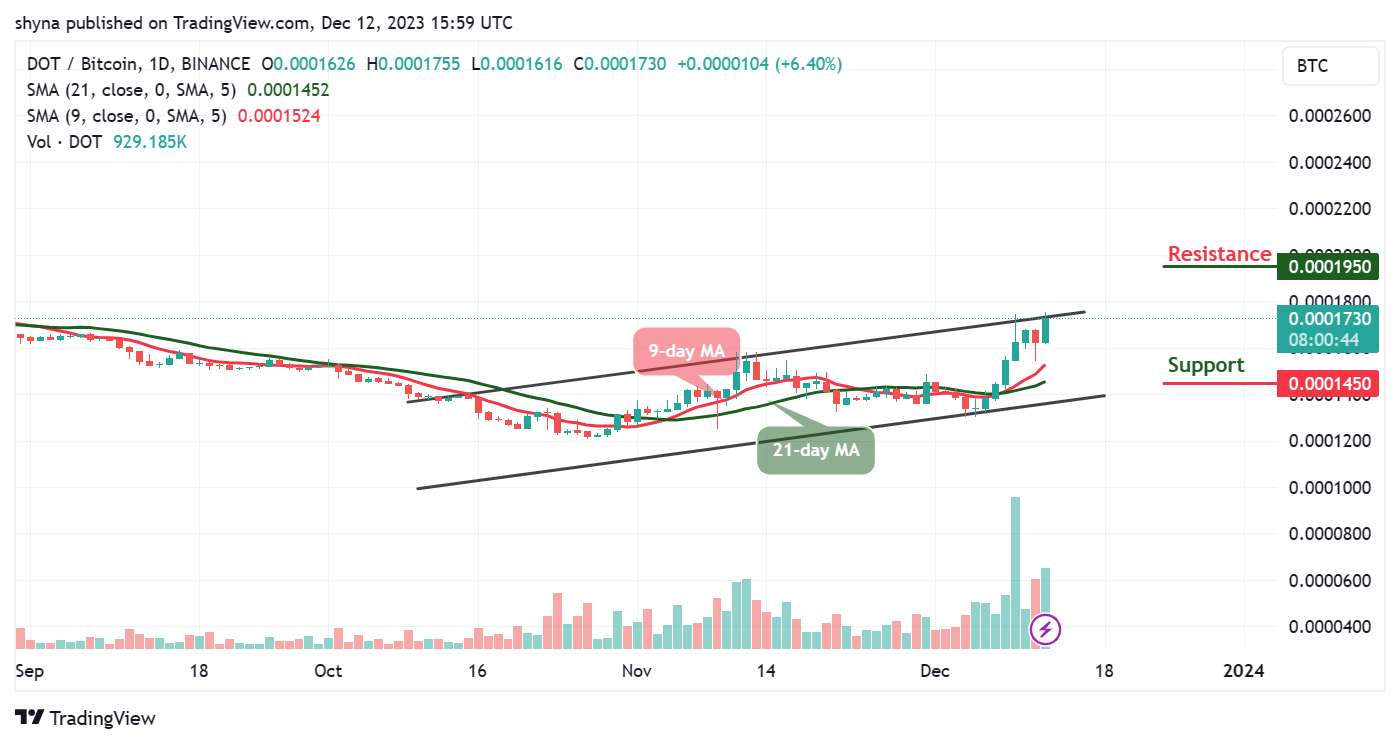
Against Bitcoin, the Polkadot price is following a bullish movement as the coin keeps hovering above the 9-day and 21-day moving averages. However, if the bears attempt to gain momentum, they are likely to release huge pressure on the market if the 9-day MA crosses below the 21-day MA to suggest bearish signals.

However, if the coin heads toward the lower boundary of the channel, it may likely hit the nearest support at 1500 SAT. Any further negative movement could lower the price to 1450 SAT and below. Meanwhile, in case of a rebound, any bullish cross above the upper boundary of the channel may locate the resistance at 1950 SAT and above.
Alternatives to Polkadot
The Polkadot price is currently showing a 7.15% gain, trading above the 9-day and 21-day moving averages. However, caution is advised as recent candle formations, while respecting upward movement, may pose a risk if they cross below the moving averages. Meanwhile, the closest support level is at $6.5 as a bullish wave could drive the price significantly above the upper boundary of the channel. Therefore, traders should closely monitor these factors for informed decision-making.
However, the Polkadot (DOT) is facing challenges for quick gains due to its $8.8 billion market cap, while Bitcoin Minetrix, with a smaller market cap, holds substantial growth potential, particularly in mining. The token is positioned strategically and aligned with Bitcoin protocol fundamentals as it has already raised over $5.2 million in its ongoing presale, indicating strong support and promising growth prospects.
Join Our Telegram channel to stay up to date on breaking news coverage


