Join Our Telegram channel to stay up to date on breaking news coverage
The dYdX price prediction is breaking above the $3.0 resistance level as DYDX trades bullishly above the moving averages.
dYdX Prediction Statistics Data:
- dYdX price now – $3.14
- dYdX market cap – $902.8 million
- dYdX circulating supply – 309.2 million
- dYdX total supply – 536 million
- dYdX Coinmarketcap ranking – #70
DYDX/USD Market
Key Levels:
Resistance levels: $4.30, $4.40, $4.50
Support levels: $2.00, $1.90, $1.80
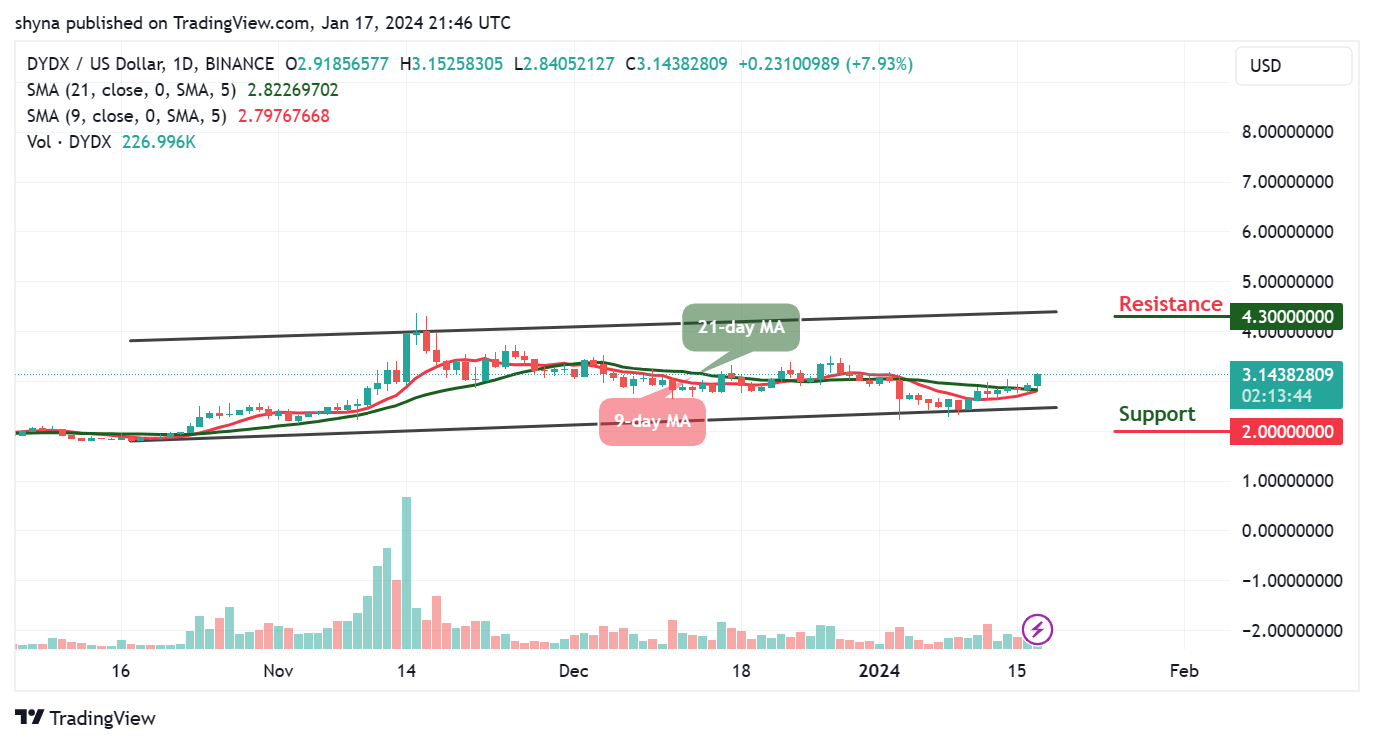
DYDX/USD is seen refreshing to a new daily high as the coin heads to the upside to trade close to the resistance level of $3.5. Meanwhile, the coin is currently trading at $3.14 with a bullish movement but has yet to trade near the upper boundary of the channel. On the contrary, if the dYdX price slides below the lower boundary of the channel, sellers could return to the market, but the bulls are likely to collect more on the price dips.
dYdX Price Prediction: DYDX Could Head to the Upside
The dYdX price can only continue with the upward movement if the newly touched $3.1 resistance level is maintained at all costs. At the moment, the 9-day MA is likely to cross above the 21-day MA to encourage more buyers. However, dYdX (DYDX) can now begin to follow the uptrend as soon as the hits the nearest resistance level of $3.50.
Nonetheless, if the coin touches the above-mentioned resistance level, the dYdX price could perform well and may reach the resistance levels at $4.30, $4.40, and $4.50 respectively. Meanwhile, if the market price slides toward the south, there may be a bearish drop below the lower boundary of the channel which could roll the coin down to the support levels of $2.00, $1.90, and $1.80 respectively.
DYDX/BTC May Create Additional Gains
Against Bitcoin, the dYdX price is hovering above the 9-day and 21-day moving averages as the price touches the daily high at 7395 SAT. However, the 9-day moving average is seen crossing above the 21-day moving average as the coin aims for more uptrends.
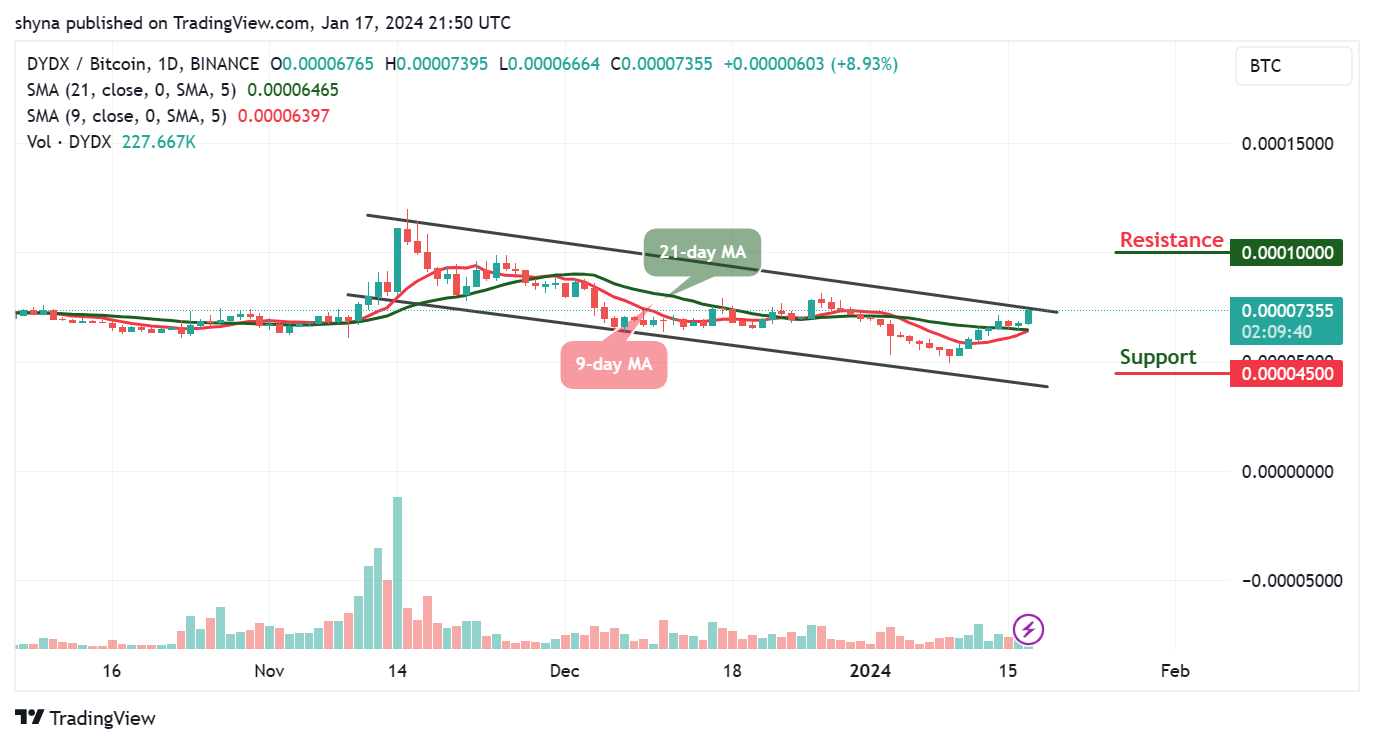
Moreover, the potential resistance level is located at 1000 SAT and above, but a lower sustainable move may cancel the bullish movement and could attract new sellers coming into the market with the next focus on the support level of 450 SAT and below.
dYdX Alternatives
If the buyers could increase the buying pressure, the dYdX price may continue to hover above the 9-day and 21-day moving averages. For the fact that the coin is trading at $3.14, the dYdX price may continue to follow the bullish movement. Therefore, traders can expect the coin to move near the upper boundary of the channel to hit the potential resistance level of $4.0.
Nonetheless, Bitcoin Minetrix has emerged as a frontrunner in the cryptocurrency arena due to its innovative cloud mining solution and successful presale, accumulating an impressive $9.0 million. Meanwhile, dYdX (DYDX) is on an upward trajectory with a market cap of $902.8 million. All eyes are now on Bitcoin Minetrix, speculating on its imminent ascent to prominence in the crypto sphere.
Join Our Telegram channel to stay up to date on breaking news coverage