
Join Our Telegram channel to stay up to date on breaking news coverage
Crypto markets were rocked by $1.7 billion in liquidations over the past 24 hours as Bitcoin, XRP, and Dogecoin all slumped.
Data from CoinGlass showed that more than 401,000 traders were liquidated, with 95% coming from long positions.
This is the biggest liquidation since March, with over 95% coming from long positions
Why is an event like this important?
-The market is overheating
– Over-leveraged Longs need to get flushed to reset the market.
Now, the market is setting the stage for the next major move… pic.twitter.com/7naCc4bSLj
— Ash Crypto (@Ashcryptoreal) September 22, 2025
The single largest wipeout was a $12.74 million BTC long on OKX, underscoring how quickly bullish bets unraveled as prices turned lower.
Bitcoin slid 2.5% to $112,754 as of 4:47 a.m. EST, while XRP and Dogecoin posted steeper losses of 5.9% and 10%, respectively, according to Coingecko.
The broader crypto market shed more than 3% over the past day, pulling total market capitalization down to $3.99 trillion.
A handful of tokens managed to buck the trend, with Story (IP) up 10.5%, MemeCore (M) rising 5.1%, and Pax Gold (PAXG) edging 1.1% higher.
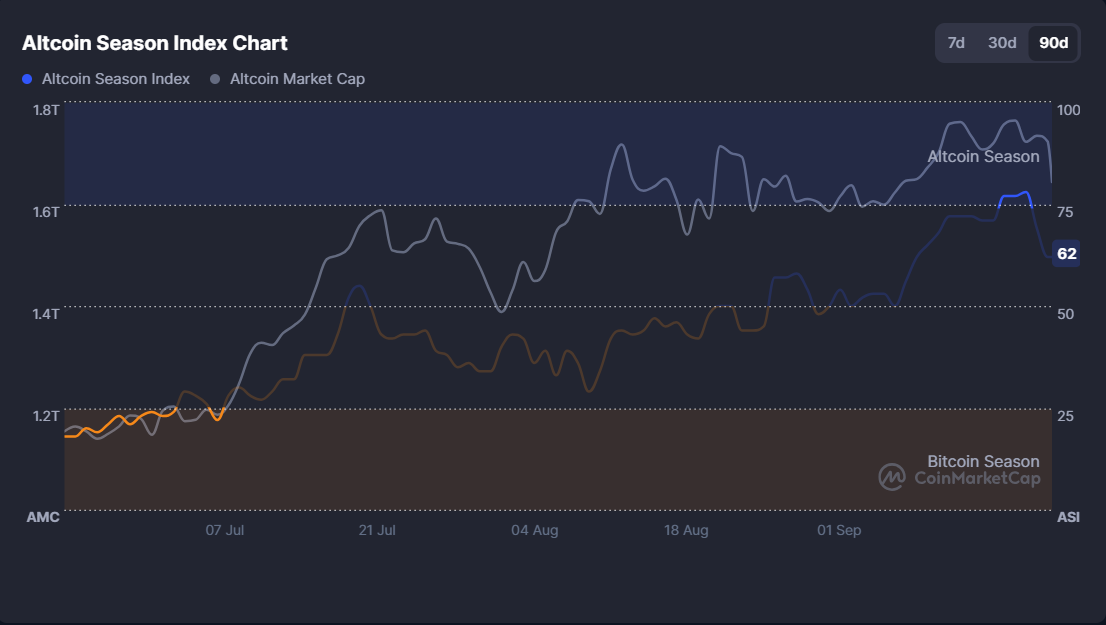
Meanwhile, the CMC Altcoin Season Index shows that the altcoin season may be in jeopardy as it dropped from 78 to 62/100.
Bitcoin Price On The Edge: Holding The Channel Or Breaking Down?
The BTC price is currently trading at $112,358, showing a decline of nearly 3% in the latest candle.
Bitcoin price action has been moving within a well-defined rising channel pattern since late 2023, signaling a broader bullish structure. However, recent candles suggest weakening momentum as the market tests the lower boundary of this channel.
The Fibonacci retracement levels highlight immediate support near $107,515 (0.236 level) and stronger support at $97,365 (0.382 level), while resistance remains at the recent high of $123,922.
Looking at the indicators, the 50-day Simple Moving Average (SMA) at $110,210 is acting as a near-term support. A sustained close below this level could trigger further downside toward the 200-day SMA at $83,296, which remains a key long-term support zone.
Meanwhile, the Relative Strength Index (RSI) sits at 49.38, hovering around the midpoint, suggesting a neutral market with no clear overbought or oversold conditions.
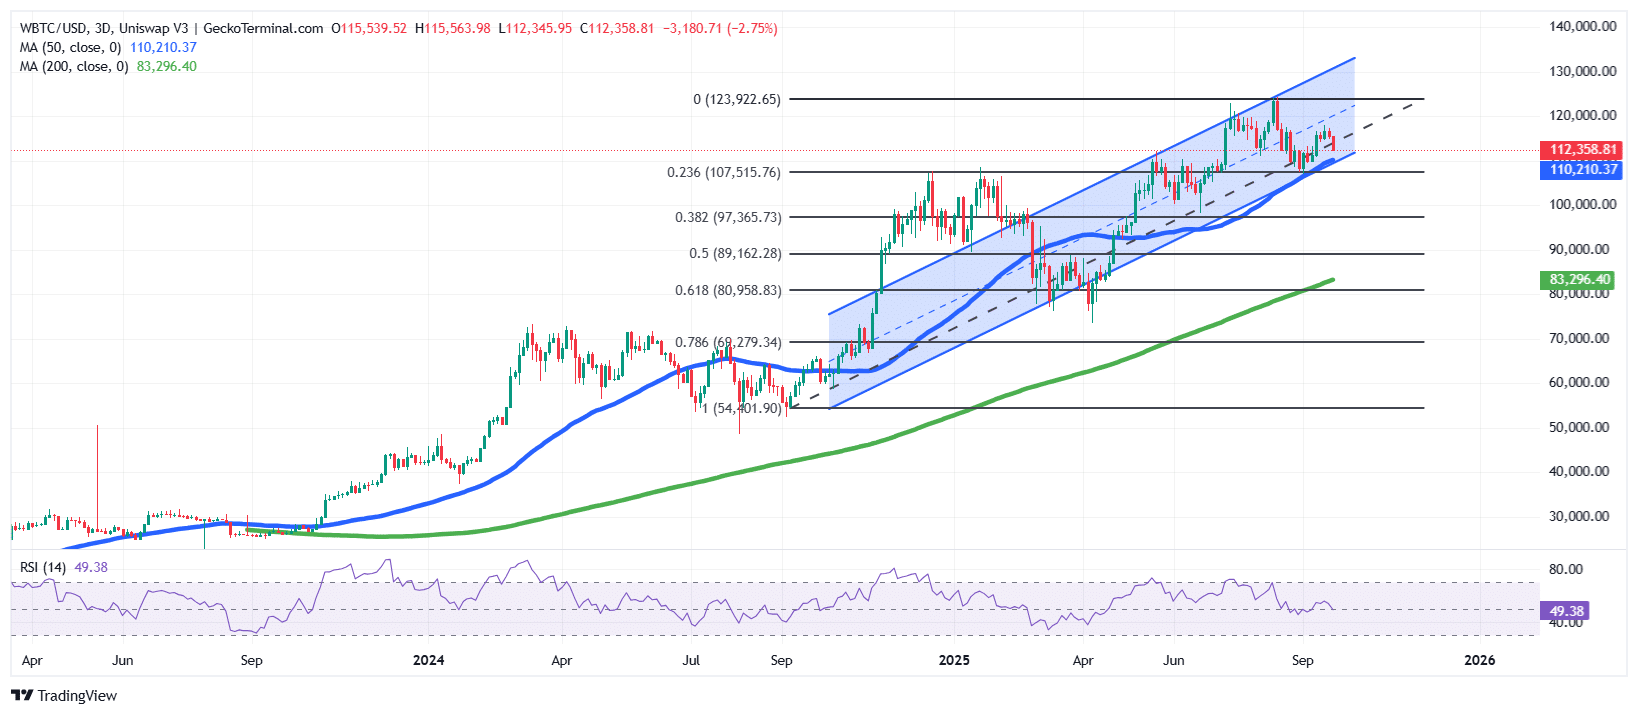
If buyers defend the 50-day SMA, the price of Bitcoin could retest the channel top near $123,000. Conversely, a breakdown may drag the market toward $97,000 in the weeks ahead.
XRP And DOGE Prices Under Pressure: Can Bulls Defend Key Supports?
XRP is currently trading at $2.82, down more than 5% on the day. After a strong parabolic curve earlier this year, the price has since been consolidating in a downward channel.
The chart shows a Golden Cross, with the 50-day moving average ($3.00) rising above the 200-day moving average ($2.52), often seen as a bullish long-term signal. However, short-term momentum remains weak.
The RSI at 39.75 indicates bearish pressure, leaning toward the oversold zone.
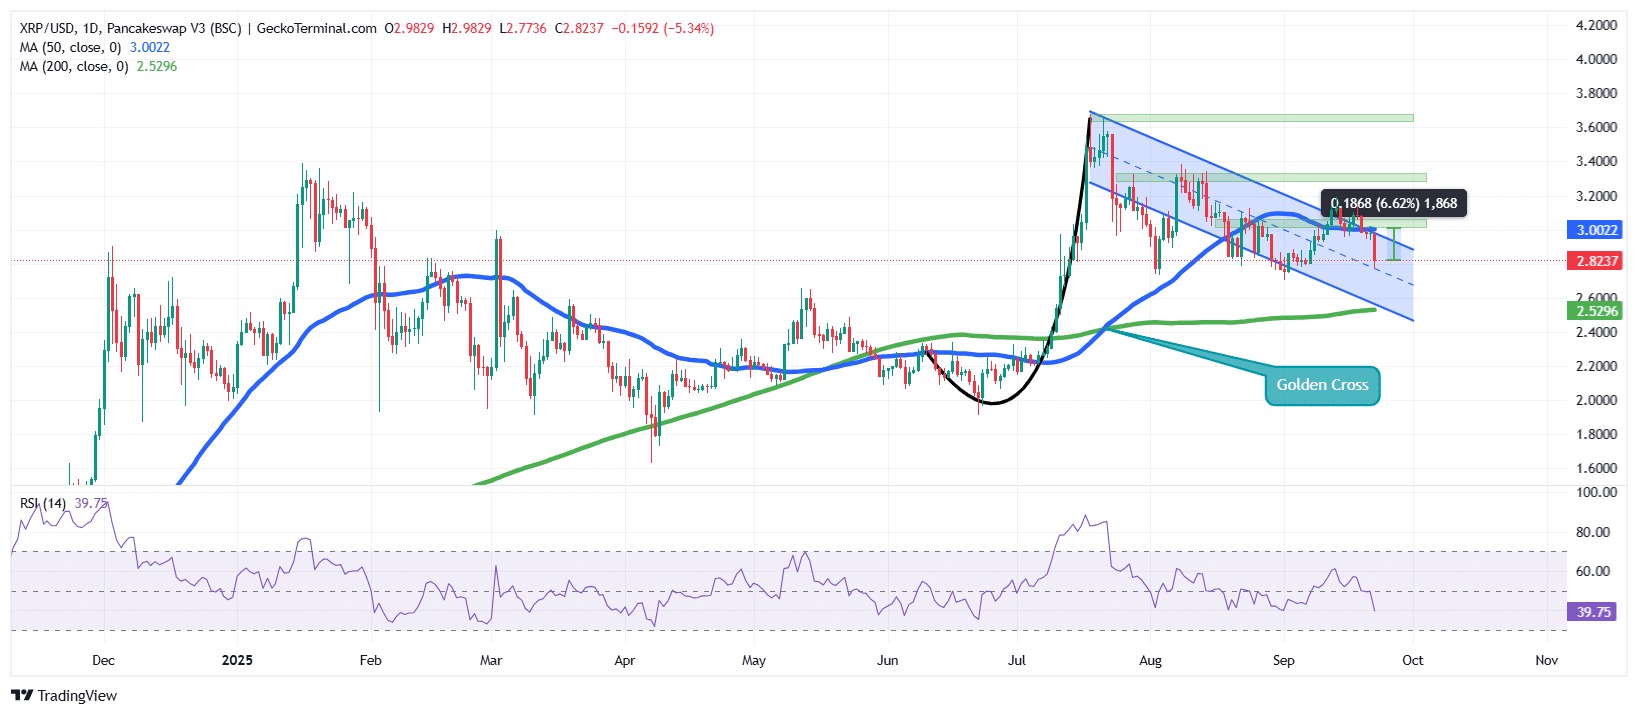
If the Ripple token price holds above the 200-day SMA, it could stage a rebound toward the $3.20–$3.40 range. Failure to do so may open the door to deeper retracements near $2.50.
Meanwhile, Dogecoin is trading at $0.2390, sliding nearly 10% in the latest session after recently testing resistance near $0.3055.
The DOGE price is retracing from its highs, with the asset now hovering just above the 50-day Simple Moving Average (SMA) ($0.2348). This area aligns closely with the 0.5 Fibonacci retracement level ($0.2312), making it a critical support zone.
The 200-day SMA ($0.1999) continues to trend upward, confirming a longer-term bullish foundation. However, the RSI at 45.46 suggests weakening momentum, leaving DOGE in neutral territory but leaning toward bearish pressure.
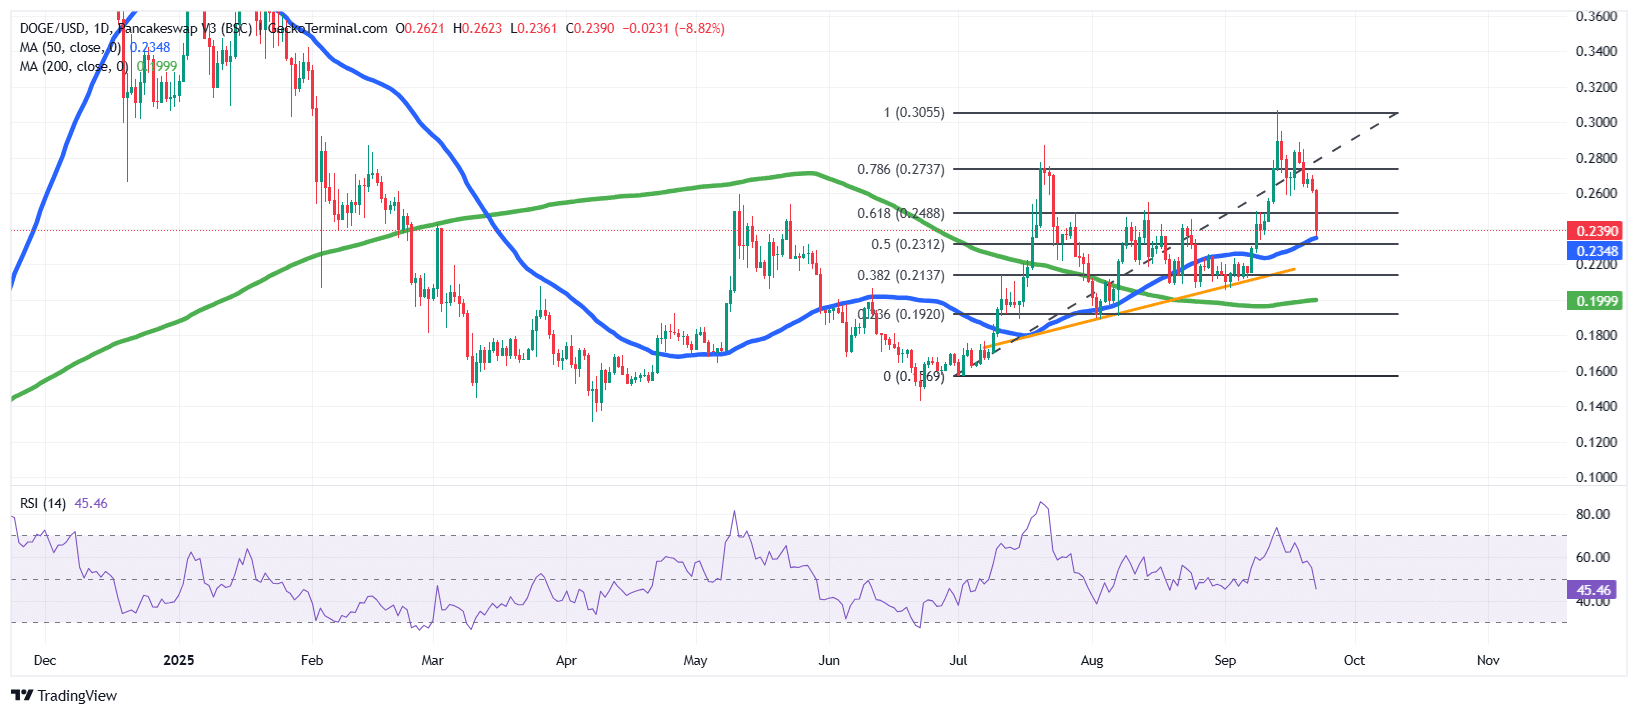
If the 50-day SMA holds, DOGE could attempt another move higher toward $0.2737 and potentially retest the $0.30 zone.
On the other hand, a decisive breakdown below $0.2312 could drag the price back toward $0.21–$0.20, testing the strength of long-term buyers.
Related News:
- NFT Weekly Sales Plunge By 2.25% To $106M
- Bitcoin Price Falls 1% As Metaplanet Buys $632M Bitcoin, Saylor Hints At A New Buy
- BNB Price Drops To $1,033 After ATH As CZ Hints That Bull Market May Be Starting
Best Wallet - Diversify Your Crypto Portfolio

- Easy to Use, Feature-Driven Crypto Wallet
- Get Early Access to Upcoming Token ICOs
- Multi-Chain, Multi-Wallet, Non-Custodial
- Now On App Store, Google Play
- Stake To Earn Native Token $BEST
- 250,000+ Monthly Active Users
Join Our Telegram channel to stay up to date on breaking news coverage
