Join Our Telegram channel to stay up to date on breaking news coverage
Bitcoin (BTC) Price Prediction – January 15
Bitcoin price extends the bearish leg to areas marginally below $34,500 after numerous trials to sustain gains above $40,000.
BTC/USD Long-term Trend: Bullish (Daily Chart)
Key levels:
Resistance Levels: $43,000, $45,000, $47,000
Support Levels: $30,000, $28,000, $26,000
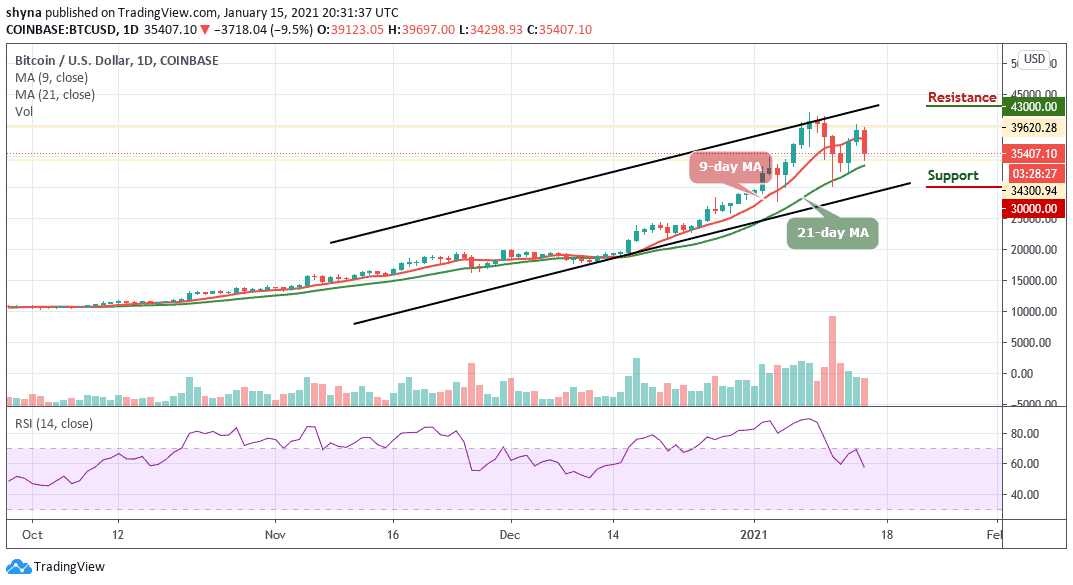
BTC/USD is seen falling towards $34,000 once again as the largest cryptocurrency embarked on a support smashing exercise after failing to hold above $40,000 following a significant breakout yesterday. However, the bearish control is widespread across the market with other major digital assets posting similar losses as they trade below the 9-day moving average.
What is the Next Direction for Bitcoin?
The Bitcoin price just plunged below $35,000 one more time, marking $34,298 as the current daily low. Does this mean that Bitcoin (BTC) is finally leaving the significant $40,000 level and searching for a new low? Meanwhile, looking at the declining daily volume candle, together with the steady but stable recent Bitcoin price action, it can be assumed that a stronger move may be coming up soon into the market.
At the time of writing, BTC/USD is struggling to maintain the $39,000 level and if the coin follows the downward trend as the RSI (14) is about to cross below the 60-level, the next supports may likely come at $30,000, $28,000, and $26,000. From the upside, by maintaining the current level of $35,400, a further movement could go above the upper boundary of the ascending channel to send the price to the resistance levels of $43,000, $45,000, and $47,000 which will be well above the channel.
BTC/USD Medium-Term Trend: Ranging (4H Chart)
On the 4-hour chart, BTC price hovers below the 9-day and 21-day moving averages around $36,308 which may take time to persistently trade above the moving averages. However, if the bulls gather enough strength and regroup, the upward movement may likely near the $40,000 and $42,000 resistance level.
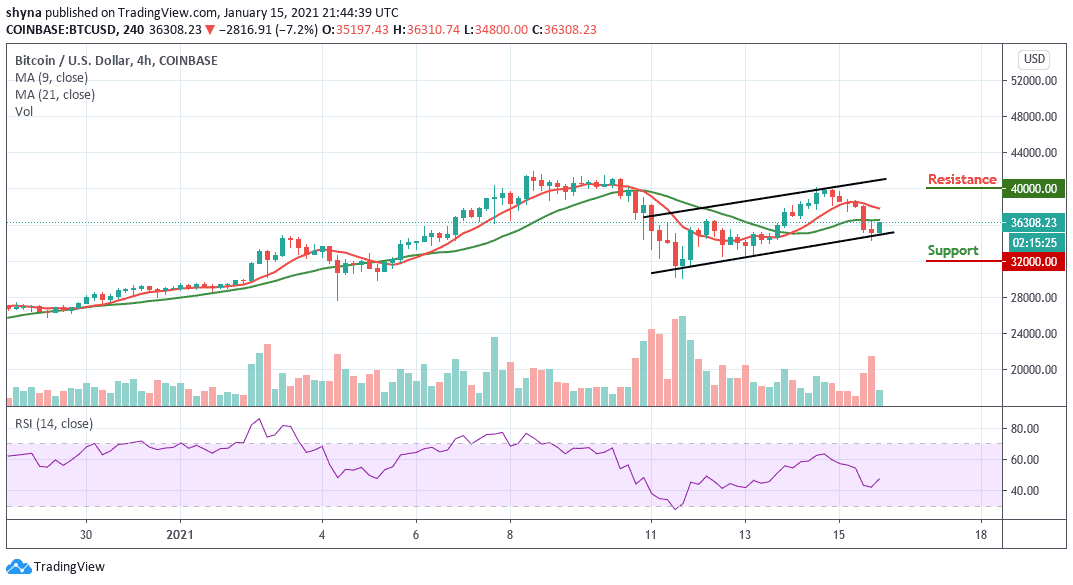
Meanwhile, on the downside, immediate support is around the $34,500 level while the main support is at the $33,000 level. The price may likely fall below $32,000 if the bears step back into the market, a further movement could reach the critical support at $30,000 level. Technically, BTC/USD is still facing the north as the RSI (14) moves above the 40-level, indicating a bullish trend within the market.
Join Our Telegram channel to stay up to date on breaking news coverage