Join Our Telegram channel to stay up to date on breaking news coverage
The Bitcoin price prediction reveals that BTC may likely head to the downside as its price moves below $20,000.
Bitcoin Prediction Statistics Data:
- Bitcoin price now – $19,913
- Bitcoin market cap – $378 billion
- Bitcoin circulating supply – 19.1 million
- Bitcoin total supply – 19.1 million
- Bitcoin Coinmarketcap ranking – #1
BTC/USD Long-term Trend: Ranging (Daily Chart)
Key levels:
Resistance Levels: $24,000, $26,000, $28,000
Support Levels: $17,000, $15,000, $13,000
Your capital is at risk
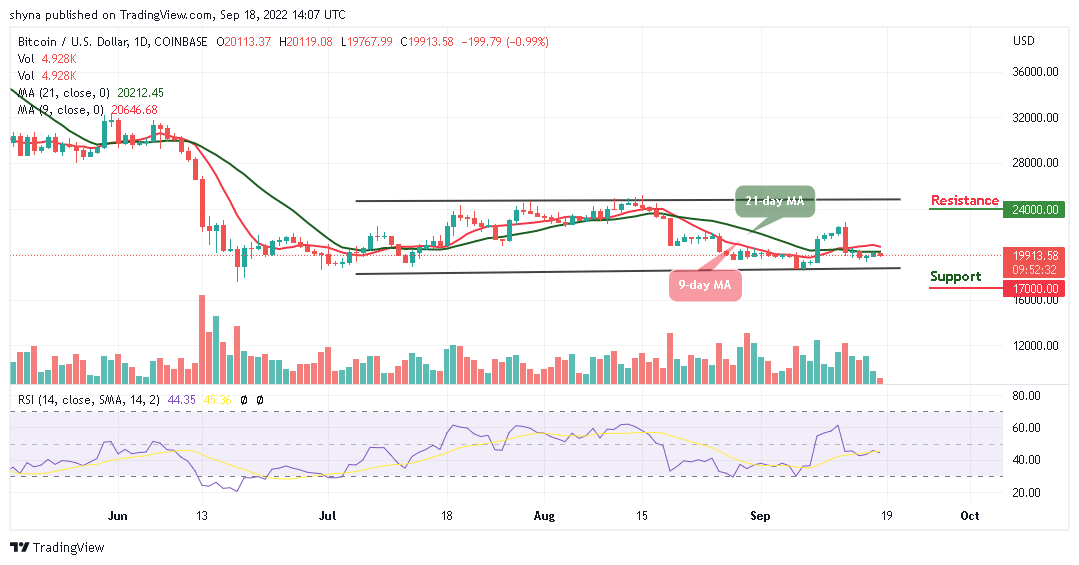
BTC/USD is trading around $19,913 below the 9-day and 21-day moving averages. Looking at the daily chart, Bitcoin (BTC) is trading on average, and it is likely to slide and touch the support level of $19,500. The king coin is now plunging below the former resistance level of $20,000 which may cause many investors to take profits off the table.
BTC Could Break More Downs as TAMA is rated a BUY
The Bitcoin price is currently changing hands at $19,913, however, where BTC trends next may partly depend on whether or not buyers can close today’s candle above the $20,000 level. Should in case this comes to play, the bulls may propel prices higher, and then traders may expect the king coin to rise above the $22,000 resistance, which could later move towards the potential resistance levels at $24,000, $26,000, and $28,000.
On the other hand, if the Bitcoin price failed to close above the $20,000 resistance level; the price could drop below the lower boundary of the channel. A further low drive could send the price to $17,000, $15,000, and $13,000 supports. Meanwhile, the technical indicator Relative Strength Index (14) has recently revealed a sign of trend reversal as the signal line shows a possible bearish momentum within the chart.
BTC/USD Medium-term Trend: Ranging (4H Chart)
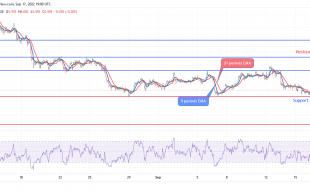
Looking at the 4-hour chart, following the rejection of $19,875, BTC/USD is trading below the 9-day and 21-day moving averages. Looking at it from above, if Bitcoin holds above $19,600, then the next level of resistance could be $21,000, along with the significantly mentioned ascending trend-line. The next resistance could be $21,500 and above.
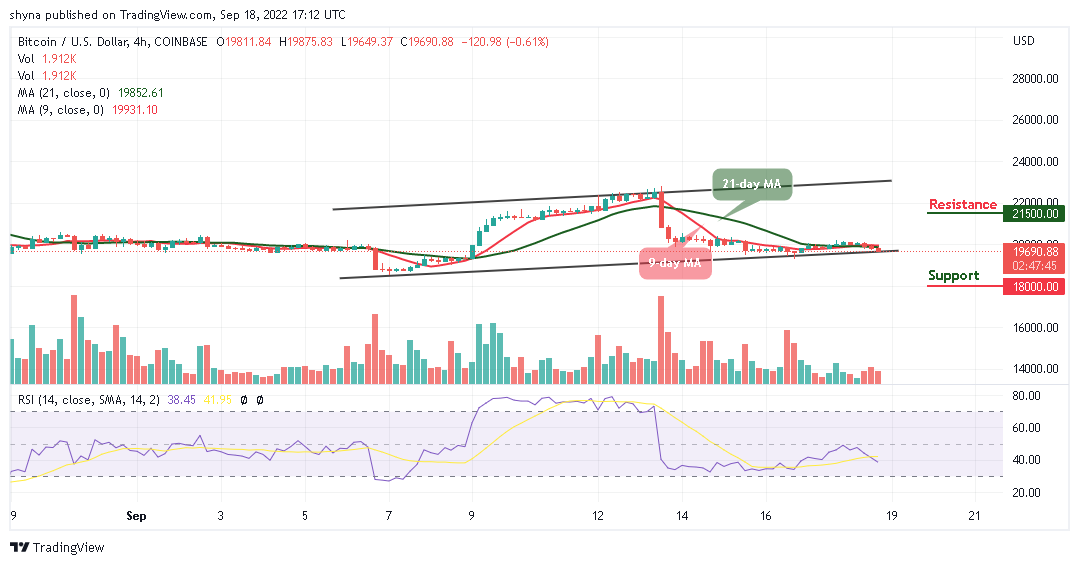
Meanwhile, as the technical indicator remains below, this might have signaled a temporary end to the bullish trend of Bitcoin for a moment. However, if the coin falls below the lower boundary of the channel, the market price may likely reach the support levels of $18,000 and below.
The Tamadoge team said that the move aims to make investing in TAMA easy and safe. These users can be confident in transferring fiat into crypto, hence the need for Tamadoge to secure this deal with Transak. One of the strongest pillars of any project in the web 3.0 & crypto sector is having a solid team to see the project succeed. The TAMA website has revealed Thomas Seabrook as the Tamadoge lead developer and Carl Dawkins as the head of growth. The other members of the Tamadoge team include Neil Palethorpe and Siphamandla Mjoli, who have joined as the Senior Interaction Designer and the Senior Blockchain Developer, respectively.
Related:
- How to Buy Tamadoge
- Visit Tamadoge Website
Join Our Telegram channel to stay up to date on breaking news coverage