Join Our Telegram channel to stay up to date on breaking news coverage
Bitcoin Price Prediction – October 20
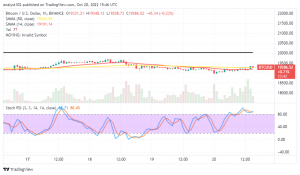
Buyers and sellers are not pushing for a significant direction in the BTC/USD market operation. Therefore, the situation is dense as the price may relax near the $20,000 line for some time. After rising and decreasing between $19,342.12 and $18,923.03, price now trades around $19,280.42 at a minute 0.79 percent positive.
BTC/USD Market
Key Levels:
Resistance levels: $22,500, $25,000, $27,500
Support levels: $17,500, $15,000, $12,500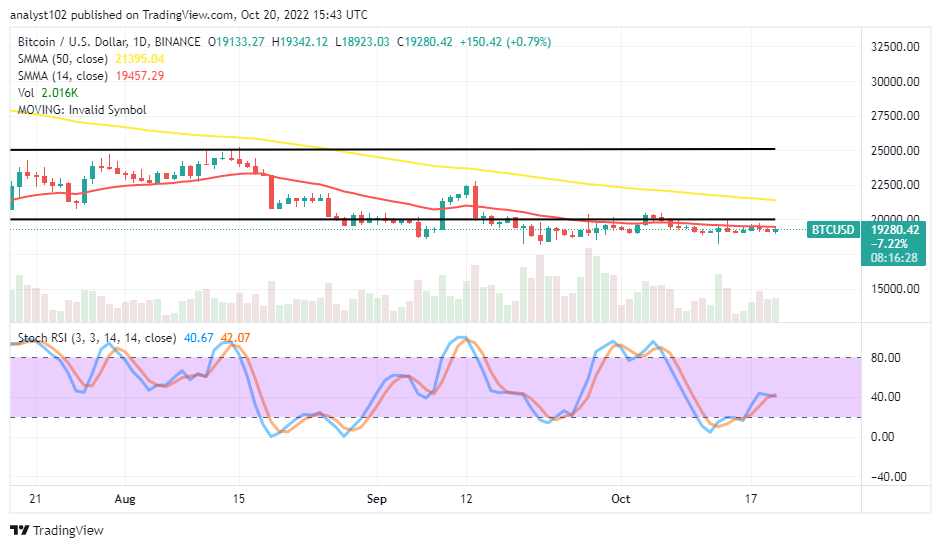 BTC/USD – Daily Chart
The daily chart reveals Bitcoin market may relax closely below $20,000 against the US Dollar for a while. The 145-day SMA indicator is at $19,457.29, beneath the $21,395.04 value point of the 50-day SMA indicator. Variant trading Japanese candlesticks have been forthcoming to characterize lower lows around the trend line of the smaller SMA. The Stochastic Oscillators have faintly swerved northbound from within the oversold at the range of 40, trying to close their lines at 42.07 and 40.67 range values.
What could be the next BTC/USD market direction from its present trading zone?
It may be a while before the next BTC/USD market direction definite trend as the crypto economy may relax below the $20,000 logical trading level it has been keeping over time. Buyers are taking time to find a stance to rebuild energy above the $17,500 support level before swinging northward. The trading point earlier mentioned remains the barrier spot that the price needs to breach past convincingly to solidify a return of bullish-trading moment.
On the downside of the technical analysis, there needs to be a continual rejection-trading pattern around the lower horizontal line drawn around the $20,000 support level to affirm the possibility of the BTC/USD market bears prevailing over any buying spree intended to surface. A 1-hour and 4-hour charts suggest an overbought-trading condition at the same period to observe the launching of a selling order.
BTC/USD 4-hour Chart1
The BTC/USD medium-term chart showcases the crypto market may relax below the $20,000 logical level. The 14-day SMA indicator is at $19,272…83, underneath the $19,362.99 point of the 50-day SMA. The Stochastic Oscillators have crossed to 17.70 and 33.13 range values, denoting a relatively trying to signal a buying time is ongoing. At the moment, it could be a better chance for investing attitude. And it is a sign that the previous trading volume before the present needs to hold for a long term.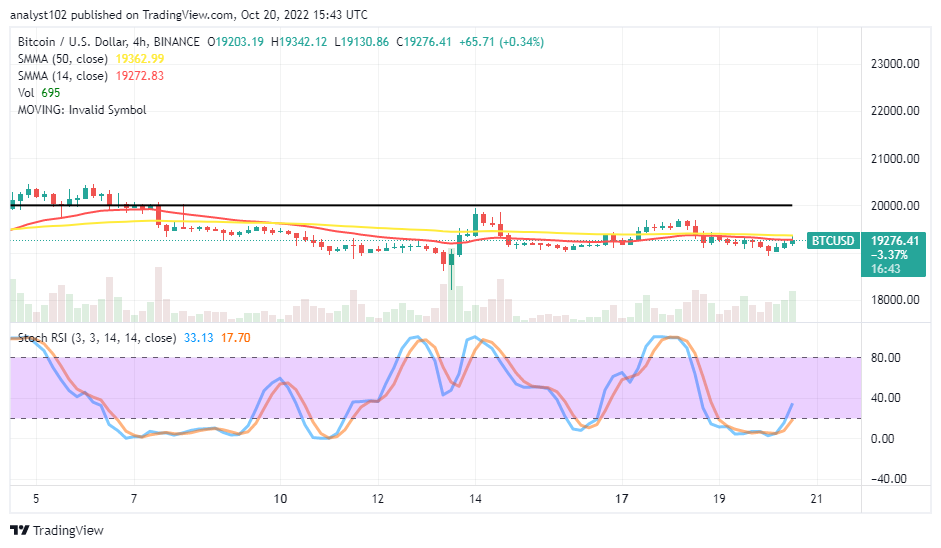
Related
- Bitcoin (BTC) Statistics:
Current Price: $19,270.17
Market Capitalization: $369.94 billion
Trade Volume: $23.1 billion
7-day Gain: 1.26%
Read more:
- How to buy Bitcoin
- How to buy cryptocurrency
In-Content Heroes
Join Our Telegram channel to stay up to date on breaking news coverage