Join Our Telegram channel to stay up to date on breaking news coverage
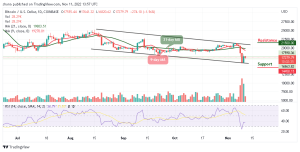
The daily chart reveals that the Bitcoin price prediction may extend the bearish movement to the areas below the support level of $17,000.
Bitcoin Prediction Statistics Data:
- Bitcoin price now – $17,279
- Bitcoin market cap – $330.5 billion
- Bitcoin circulating supply – 19.2 million
- Bitcoin total supply – 19.2 million
- Bitcoin Coinmarketcap ranking – #1
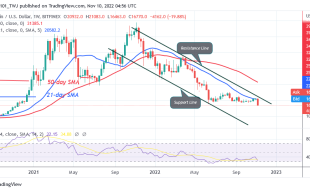
Bitcoin Price Prediction Long-term Trend: Bearish (Daily Chart)
Key levels:
Resistance Levels: $21,500, $22,500, $23,500
Support Levels: $14,458, $13,458, $12,458
BTC/USD falls below $17,500 once again as the first digital asset embarks on support after the coin failed to hold above the resistance level of $17,641. According to the daily chart, the bearish control is seen across the market as the sellers are making effort to increase the bearish movement.
Bitcoin Price Prediction: Bitcoin (BTC) Could Touch $16k Support
The Bitcoin price is hovering at $17,279 with an intraday loss of 1.56%. Looking at the daily chart, the prevailing trend is bearish with expanding volatility as the first digital asset is likely to consolidate in a bearish flag pattern. Meanwhile, a breakdown below the lower boundary of the channel is supposed to continue in the direction of the previous trend. In this case, BTC/USD is expected to drop and stay below to hit the critical support levels at $14,458, $13,458, and $12,458.
However, should the Bitcoin price return above the 9-day and 21-day moving averages; the price could rise to the nearest resistance at $20,000. A further bullish drive could push the price to $21,500, $22,500, and $23,500 resistance levels. The technical indicator Relative Strength Index (14) is revealing a bearish movement, which shows that the market may continue to move down.
BTC/USD Medium-term Trend: Bearing (4H Chart)
At the opening of the market today, the Bitcoin price faces up to touch the resistance level of $17,500 but may likely drop below the 9-day and 21-day moving averages, bringing its price to trade around $16,800. Meanwhile, should the price drop and stay below the moving averages, it is likely for the coin to head towards the downside to reach the support level at $15,000 and below.
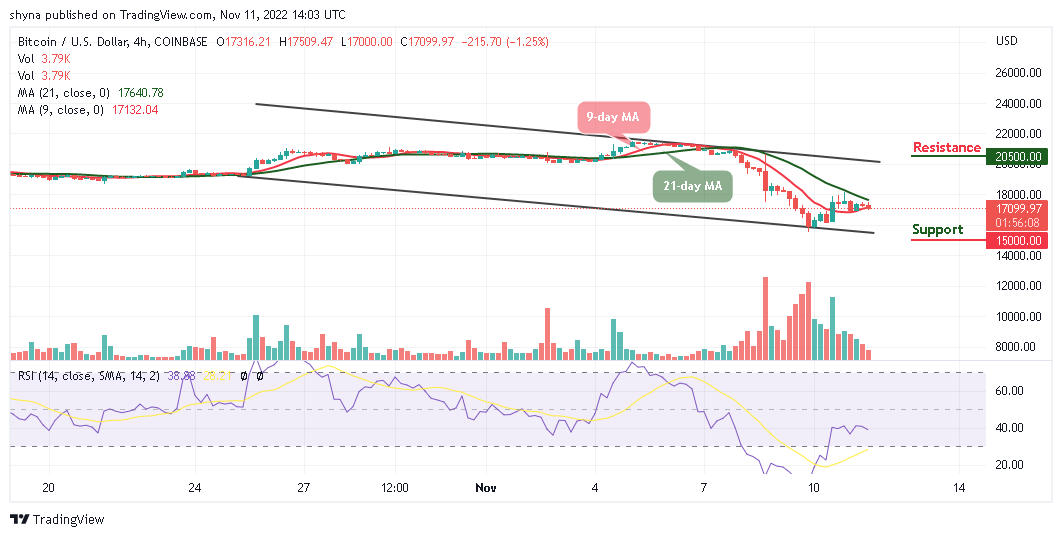
Moreover, if the bulls push the coin above the 21-day moving average, the Bitcoin price could touch the resistance level of $20,500 and above. At the moment, the market may begin to move sideways or experience downtrends as the Relative Strength Index (14) indicator moves below the 40-level.
IMPT Presale Is Still Very Hot
The Impact project aims to change the way carbon credits are managed. It currently acts as a crossroads between the ESG industry and the cryptocurrency world. Meanwhile, the IMPT pre-sale is underway, raising over $12 million in just a few weeks.
D2T Token Price Is a Good Bargain
The pre-sale of Dash 2 Trade is currently selling fast and the price is still very low. The token raises over $5 million for the future development of the platform.
Related:
- D2T Price Prediction
- How to Buy D2T
Join Our Telegram channel to stay up to date on breaking news coverage