Join Our Telegram channel to stay up to date on breaking news coverage
The Bitcoin price prediction shows that BTC rises in the early hours of today, but got rejected as the market touches the low of $27,570.
Bitcoin Prediction Statistics Data:
- Bitcoin price now – $27,711
- Bitcoin market cap – $536.4 billion
- Bitcoin circulating supply – 19.3 million
- Bitcoin total supply – 19.3 million
- Bitcoin Coinmarketcap ranking – #1
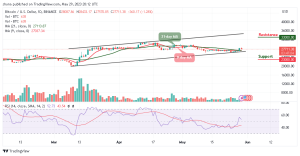
BTC/USD Long-term Trend: Ranging (Daily Chart)
Key levels:
Resistance Levels: $33,000, $35,000, $37,000
Support Levels: $23,000, $21,000, $19,000
BTC/USD may begin to follow the bearish movement if the bears force the king coin to bow down to fresh losses. At the time of writing, the Bitcoin (BTC) is changing hands at $27,711 after adjusting from the resistance level of $28,433 which is an intraday high. Moreover, the Bitcoin price may be vulnerable to losses if the price crosses below the lower boundary of the channel.
Bitcoin Price Prediction: Bitcoin (BTC) Price Could Fall Move
The Bitcoin price from a technical angle reveals that the market price may follow the downtrend or continue to move sideways because the bullish movement is not visible now. However, the technical indicator Relative Strength Index (14) may confirm the bearish movement if the signal line drops below the 50-level.
Moreover, bulls are currently banking on the lower boundary of the channel to ensure that despite a reversal, the Bitcoin price stays above this barrier. Any bearish movement below this bearer could touch the nearest support of $25,000 and may cause the coin to reach the critical supports at $23,000, $21,000, and $19,000. Following the upward movement, if the coin remains above the 9-day and 21-day moving averages; it could hit the potential resistance levels at $33,000, $35,000, and $37,000 respectively.
BTC/USD Medium-term Trend: Ranging (4H Chart)
As the 4-hour chart reveals, the Bitcoin price is seen crossing below the 9-day moving average, and the bears are likely to come back into the market while the bulls are trying to defend the $27,500 support. If not, the support level of $26,500 and below may come into play if the coin focuses on the downward movement.
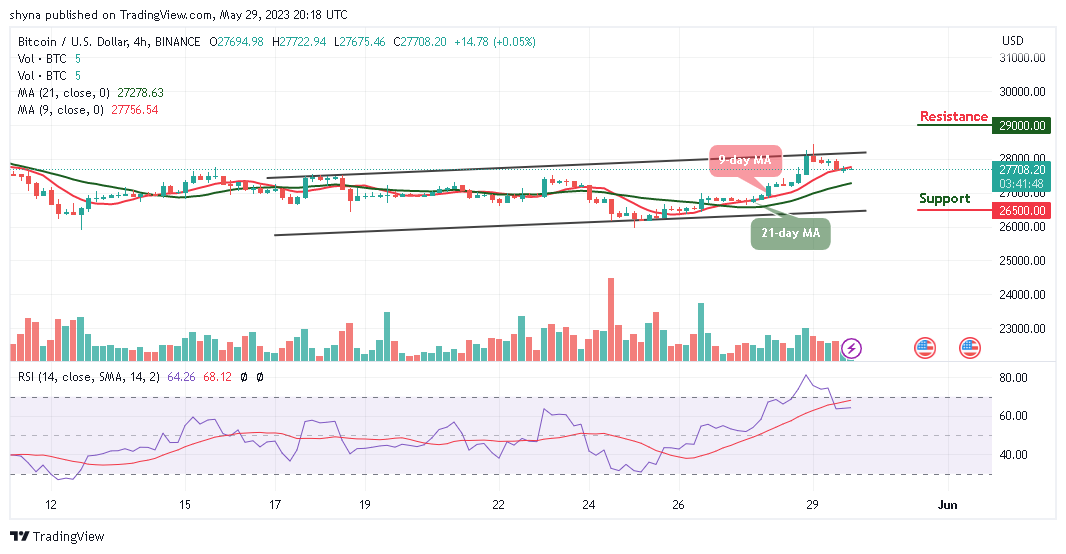
Moreover, buyers may need to regroup and hold the current level at $27,708, once this is done, traders may expect a movement above the upper boundary of the channel, and this could push the king coin to the resistance levels of $29,000 and above. Meanwhile, the technical indicator Relative Strength Index (14) is seen moving in the same direction above the 60-level, suggesting a sideways movement.
Bitcoin Alternatives
The Bitcoin price is currently facing the south, however, where BTC trends next may partly depend on whether or not buyers can close today’s candle above the $28,500 level. Should in case this comes to play, the bulls may propel prices higher, and then traders may expect the king coin to rise. However, the Wall Street Memes (WSM) token is quickly becoming the next global meme coin phenomenon after raising $1 million in a record 2 days. Like every other initiative from the WSM group, the token is turning out to be a remarkable success.
New OKX Listing - Wall Street Memes

- Established Community of Stocks & Crypto Traders
- Featured on Cointelegraph, CoinMarketCap, Yahoo Finance
- Rated Best Crypto to Buy Now In Meme Coin Sector
- Team Behind OpenSea NFT Collection - Wall St Bulls
- Tweets Replied to by Elon Musk
Join Our Telegram channel to stay up to date on breaking news coverage