Join Our Telegram channel to stay up to date on breaking news coverage
The Bitcoin price prediction gains 0.56% as bulls keep working hard to nurture a bullish trend above the moving averages.
Bitcoin Prediction Statistics Data:
- Bitcoin price now – $27,099
- Bitcoin market cap – $524.1 billion
- Bitcoin circulating supply – 19.3 million
- Bitcoin total supply – 19.3 million
- Bitcoin Coinmarketcap ranking – #1
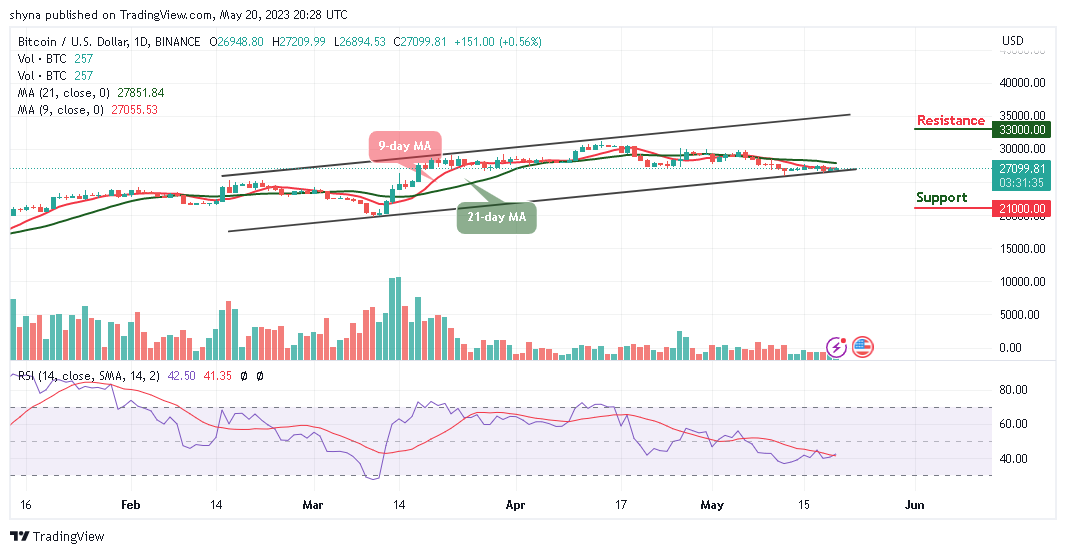
BTC/USD Long-term Trend: Ranging (Daily Chart)
Key levels:
Resistance Levels: $33,000, $35,000, $37,000
Support Levels: $21,000, $19,000, $17,000
BTC/USD is hovering at the $27,099 resistance level as the market price moves to cross above the 9-day and 21-day moving averages, indicating a bullish movement. For the past few days, the Bitcoin price has been ranging and in the context of the V exchange rate forecast; an application of $28,000 resistance is expected.
Bitcoin Price Prediction: Will BTC Break Above $28,000 Level?
Looking at the daily chart, if the Bitcoin price can move toward the upper boundary of the channel, it is likely for the market price to touch the potential resistance level of $28,000 level. This is where traders should expect buyers to fight for a further rise in the market so that the king coin can create additional gains. Meanwhile, looking at the market movement, there is likely that the Bitcoin price could experience a quick retracement or sell-off just in case it touches the crucial support level of $26,000 but if not; traders may see the coin breaking above the upper boundary of the channel to push higher.
Therefore, any further bullish movement could hit the resistance levels of $33,000, $35,000, and $37,000 respectively. On the downside, if the market price slides below the channel, BTC/USD could hit the support levels of $21,000, $19,000, and $17,000. As revealed by the technical indicator, the market may gain more if the Relative Strength Index (14) crosses above the 50-level.
BTC/USD Medium-term Trend: Ranging(4H Chart)
On the 4-hour chart, traders expect the coin to gain the lost momentum so that it could cross the upper boundary of the channel. Meanwhile, if the selling pressure exists and the coin couldn’t follow the upward movement, $25,500 and below may come into play.
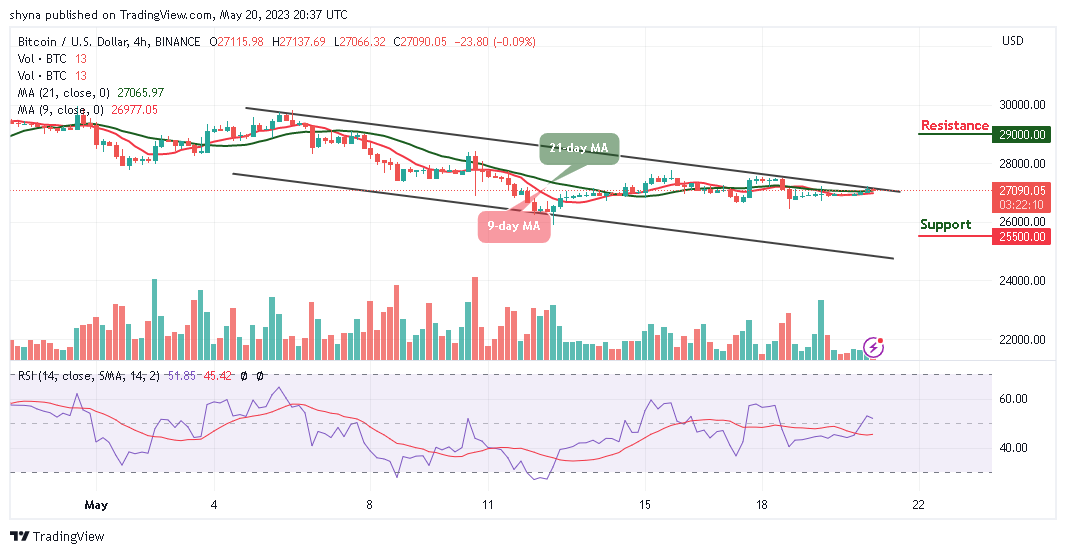
On the other hand, if the buyers keep the price above the 9-day and 21-day moving averages, traders may expect a strong bullish movement above the channel that could hit the resistance at $29,000 and above. Meanwhile, the technical indicator Relative Strength Index (14) is hovering above the 50-level, suggesting that the market price could rise.
Alternatives to Bitcoin
Looking at the daily chart, the Bitcoin price is moving sideways as the buyers brace for a possible impact within the market. Meanwhile, if the Bitcoin price slumps below the support level of $26,000, the king coin is likely to gain more downtrends. Meanwhile, the AiDoge platform uses sophisticated AI algorithms to generate quality memes which are trained on meme datasets and crypto news. Its platform uses sophisticated AI algorithms to generate quality memes which are trained on meme datasets and crypto news; the token has raised almost $12 million in the ongoing presale.
Read more:
- Litecoin Price Prediction: LTC/USD May Drop to $60 If RSI (14) Breaks Below 40
- Flow Price Prediction: FLOW Price is up 60% More to Come?
- Ripple Price Prediction: XRP/USD Is Down After Hitting $0.200 Level
Join Our Telegram channel to stay up to date on breaking news coverage