
Join Our Telegram channel to stay up to date on breaking news coverage
The Bitcoin price prediction reveals that BTC gains 0.91% as bulls keep working hard to nurture a bullish trend from the support at $28,128.
Bitcoin Prediction Statistics Data:
- Bitcoin price now – $28,653
- Bitcoin market cap – $554.4 billion
- Bitcoin circulating supply – 19.3 million
- Bitcoin total supply – 19.3 million
- Bitcoin Coinmarketcap ranking – #1
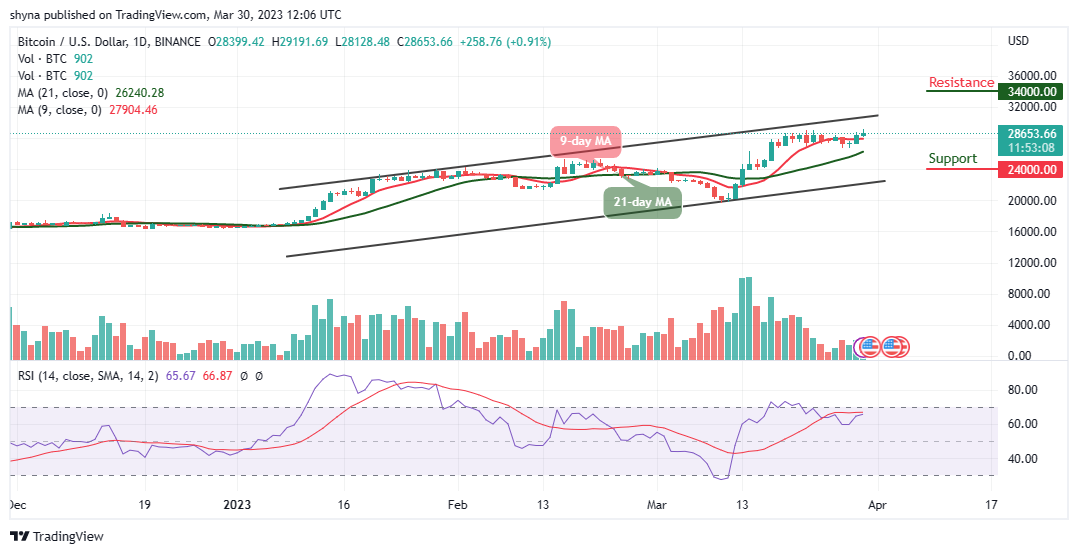
BTC/USD Long-term Trend: Bullish (Daily Chart)
Key levels:
Resistance Levels: $34,000, $36,000, $38,000
Support Levels: $24,000, $22,000, $20,000
BTC/USD is currently trading at the $28,653 resistance level as the market price is heading toward the upper boundary of the channel, indicating a bullish movement. For the past few days, the Bitcoin price has been fluctuating and in the context of this; an application of $30,000 resistance is expected.
Bitcoin Price Prediction: Will BTC Break Above $29k Resistance Level?
According to the daily chart, if the Bitcoin price crosses above the upper boundary of the channel, it is likely for the market price to touch the $30,000 level. This is where traders should expect buyers to fight for a further rise in BTC/USD and further development of the bullish trend. However, the purpose of this movement is to provide a level of resistance close to $32,000.
Meanwhile, looking at the market movement, there is likely that the Bitcoin price may experience a quick retracement or sell-off just in case it touches the crucial $29,500 level, but if not; traders may see additional resistance levels at $34,000, $36,000, and $38,000. On the downside, if the market decides to fall, the Bitcoin price could see a further decline toward the support levels of $24,000, $22,000, and $20,000. Meanwhile, the market may gain more if the Relative Strength Index (14) crosses into the overbought region.
BTC/USD Medium-term Trend: Ranging (4H Chart)
On the 4-hour chart, traders expect the coin to gain the lost momentum so that it could head toward the upper boundary of the channel. On the contrary, if the selling pressure exists, it could hold the coin not to follow the upward movement, and the $26,000 and below may come into play.
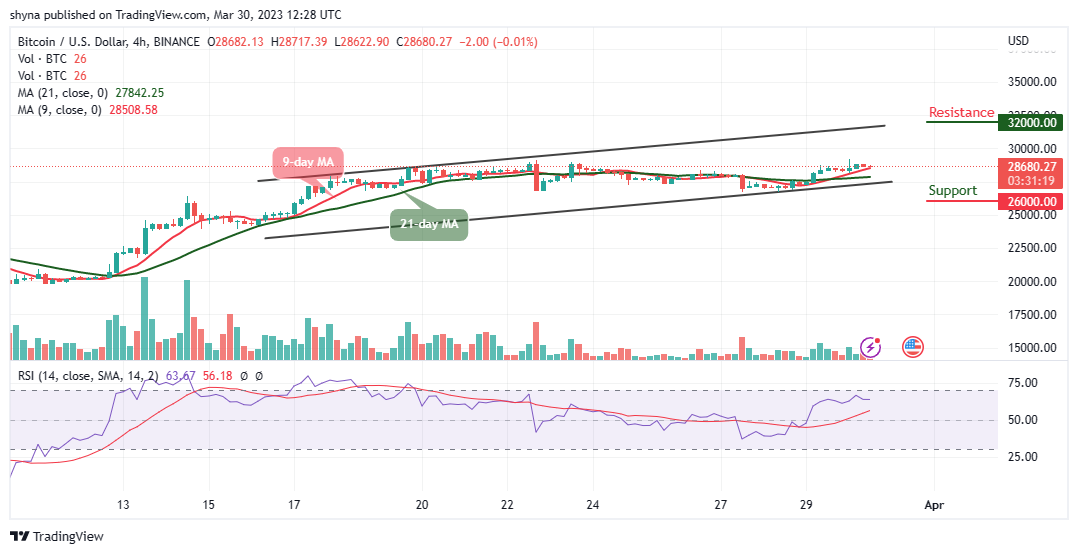
However, in as much as the buyers keep the price above the moving averages, traders may expect a strong bullish movement that could hit the resistance at $32,000 and above. Meanwhile, the technical indicator Relative Strength Index (14) is likely to cross above the 70-level, suggesting that more bullish signals may play out.
Alternatives to Bitcoin
The Bitcoin price is trading well at the moment as the king coin could hit the resistance level of $30k in the next positive direction. Actually, the king coin may retreat a little, but all this may soon change as bulls may need to keep going strong and pointing towards an upside breakout. Meanwhile, due to its high rates of return on investment, the Love Hate Inu (LHINU) token benefits traders. This token is this year’s vote-to-earn (V2E) Web3 technology with the fastest growth.
As a result, the platform allows members to engage in trending polls and surveys covering various topics such as celebrity news, social values, politics, finance, climate change, and the green revolution, among others. There has already been close to $2.5 million raised during the LHINU presale.
Join Our Telegram channel to stay up to date on breaking news coverage