Join Our Telegram channel to stay up to date on breaking news coverage
The Bitcoin price prediction shows that BTC is trading at $19,795 as the coin seems to be preparing for another upward movement.
Bitcoin Prediction Statistics Data:
- Bitcoin price now – $19,795
- Bitcoin market cap – $378.0 billion
- Bitcoin circulating supply – 19.0 million
- Bitcoin total supply – 19.0 million
- Bitcoin Coinmarketcap ranking – #1
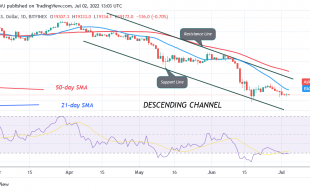
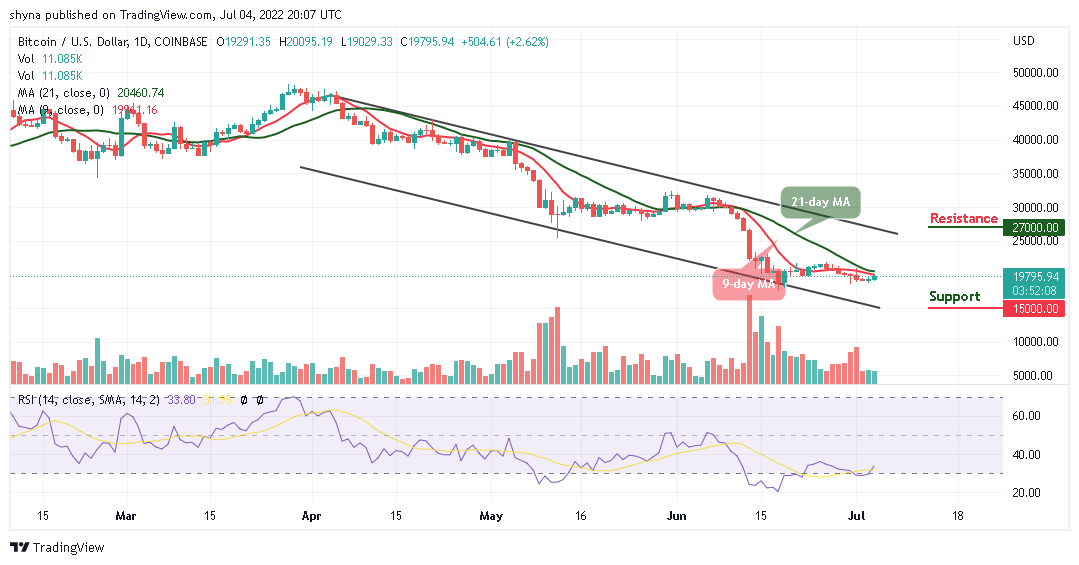
BTC/USD Long-term Trend: Bearish (Daily Chart)
Key levels:
Resistance Levels: $27,000, $29,000, $31,000
Support Levels: $15,000, $13,000, $11,000
BTC/USD is moving to cross above the 9-day and 21-day moving averages at $19,795 as the coin prepares for the upside. At the time of writing, the first digital coin is likely to extend towards the resistance level of $20,000 if the bulls put more pressure on the market.
Bitcoin Price Prediction: BTC/USD Ready for A Cross Above $20,000
At the moment, the Bitcoin price is likely to cross above the 9-day and 21-day moving averages, any further bullish movement above this barrier could locate the potential resistance levels at $27,000, $29,000, and $31,000. Normally, when new uptrends are coming up, traders may use the moving averages to gauge the strength of the trend. Nevertheless, if BTC/USD soars toward the upper boundary of the channel, this could be a sign of sustainability and may likely result in a bullish continuation.
Furthermore, if the Bitcoin price fails to move up; traders may see a price cut below the moving averages, and a further low could bring the price to the support levels at $15,000, $13,000, and $11,000 respectively. But as it stands, the Bitcoin price is likely to rise as the technical indicator Relative Strength Index (14) moves to cross above 35-level.
BTC/USD Medium-Term Trend: Ranging (4H Chart)
The BTC/USD is following a sideways movement above the 9-day and 21-day moving averages as the bulls are coming back into the market to push the king coin towards the upper boundary of the channel. If not, the support level of $18,000 and below may come into play.
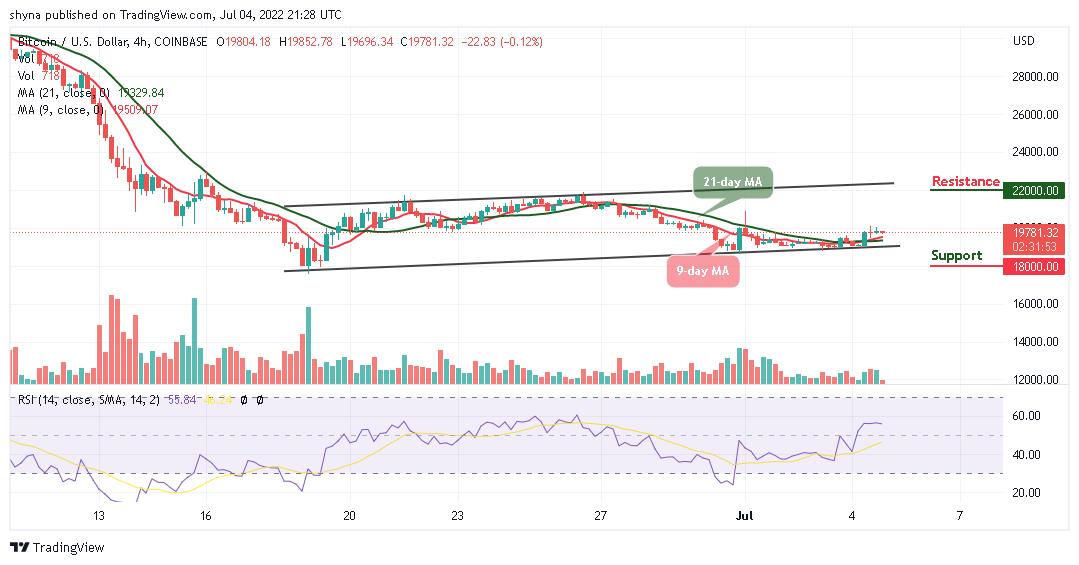
However, if the bulls push the market to cross above the resistance level of $20,000, traders may expect a retest of the $21,000 resistance level, and breaking this level may further push the price towards the resistance level of $22,000 and above as the technical indicator Relative Strength Index (14) remains above 50-level, suggesting a sideways movement.
Read more:
- How to buy Bitcoin
- How to buy Cryptocurrency
Join Our Telegram channel to stay up to date on breaking news coverage