
Join Our Telegram channel to stay up to date on breaking news coverage
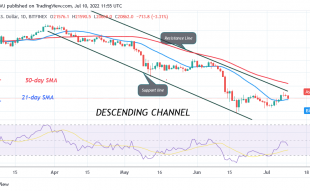
The Bitcoin price prediction indicates that BTC is following a bearish momentum as the coin falls below the 9-day and 21-day moving averages.
Bitcoin Prediction Statistics Data:
- Bitcoin price now – $20,368
- Bitcoin market cap – $389.2 billion
- Bitcoin circulating supply – 19.0 million
- Bitcoin total supply – 19.0 million
- Bitcoin Coinmarketcap ranking – #1
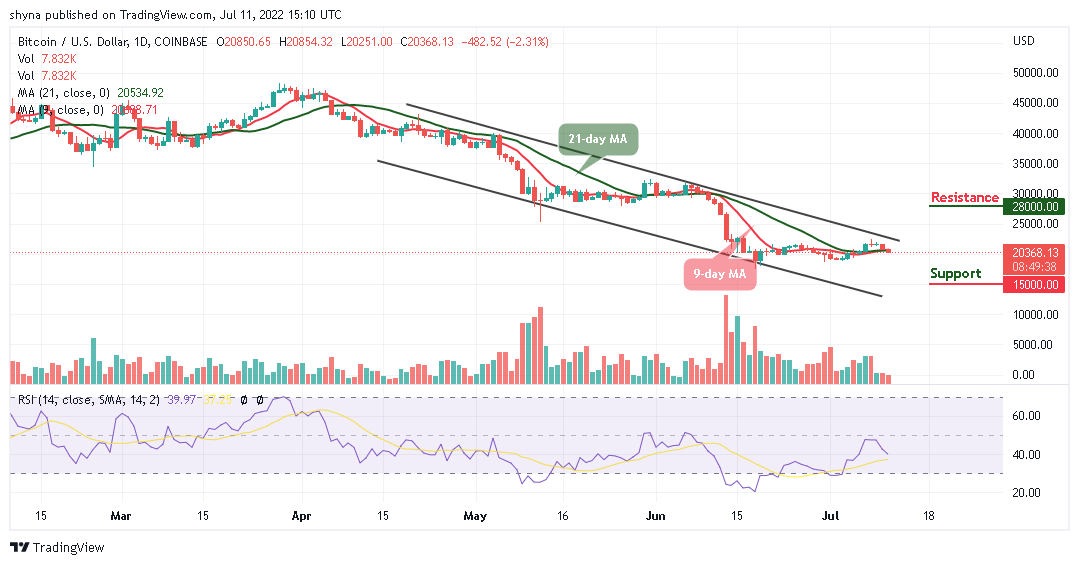
BTC/USD Long-term Trend: Bearish (Daily Chart)
Key levels:
Resistance Levels: $28,000, $30,000, $32,000
Support Levels: $15,000, $13,000, $11,000
BTC/USD is at the moment trading at $20,368, but the king coin has not been able to reclaim the resistance level of $22,000 as the coin consolidates below the 9-day and 21-day moving averages. At the moment, the Bitcoin price may continue to follow the sideways movement, but the daily chart shows that the formation of a bearish movement is likely to play out.
Bitcoin Price Prediction: BTC Price May Consolidates to the Downside
As the Bitcoin price remains below the 9-day and 21-day moving averages, BTC/USD is likely to cross below the lower boundary of the channel as the technical indicator Relative Strength Index (14) moves in the same direction below the 50-level. This could mean that the King coin is not yet ready for the upside until the red line of the 9-day moving average crosses above the green line of the 21-day moving average.
From above, recovery may not come easy as the bears may bring the king coin towards the channel’s lower boundary. Meanwhile, a sustainable move above the 9-day and 21-day moving averages may locate the resistance level of $25,000, allowing for an extended recovery towards the potential resistance levels at $28,000, $30,000, and $32,000. However, an increase in selling pressure may bring the Bitcoin price towards the supports at $15,000, $13,000, and $11,000.
BTC/USD Medium-Term Trend: Ranging (4H Chart)
Looking at the 4-hour chart, the Bitcoin price is trading below the 9-day and 21-day moving averages. BTC/USD may cross above 9-day MA as the market is trying to recover from the bearish momentum. However, if the price breaks above the 9-day moving average and heads toward the upper boundary of the channel, higher resistance could be located at $21,000. Still, on the contrary, the technical indicator Relative Strength Index (14) is seen facing the south.
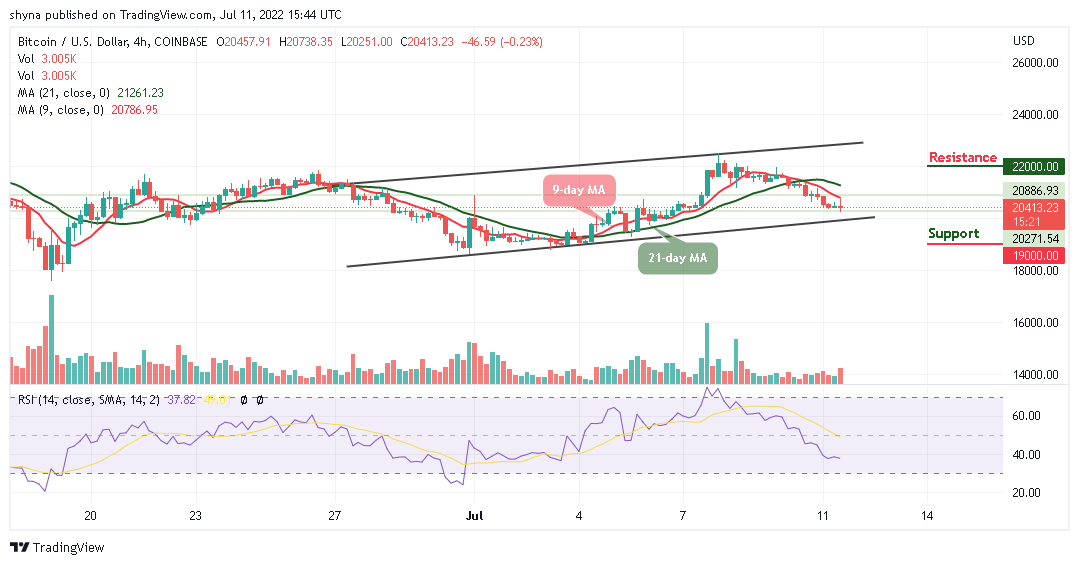
Moreover, if the bearish movement steps back, the support level of $20,000 may not be able to hold the selling pressure. Therefore, BTC/USD is likely to fall to $19,000 and below if the price moves towards the lower boundary of the channel.
Read more:
- How to buy Bitcoin
- How to buy Cryptocurrency
Join Our Telegram channel to stay up to date on breaking news coverage