Join Our Telegram channel to stay up to date on breaking news coverage
The Bitcoin price prediction shows that BTC is following the two-straight bullish day as the king coin moves toward the north.
Bitcoin Prediction Statistics Data:
- Bitcoin price now – $18,500
- Bitcoin market cap – $333.7 billion
- Bitcoin circulating supply – 19.2 million
- Bitcoin total supply – 19.2 million
Bitcoin Coinmarketcap ranking – #1
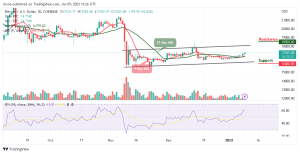
BTC/USD Long-term Trend: Ranging (Daily Chart)
Key levels:
Resistance Levels: $18,500, $20,500, $22,500
Support Levels: $16,000, $14,000, $12,000
According to the daily chart, BTC/USD is showing positive signs and might rise further above the $17,500 resistance. However, the Bitcoin price could move with strong bullish momentum after a sustainable break towards the upper boundary of the channel.
Bitcoin Price Prediction: Bitcoin (BTC) Would Move to the Upside
The technical indicator Relative Strength Index (14) shows that the Bitcoin price is ready for upward movement as the signal line crosses above the 60-level. Meanwhile, the Bitcoin price could struggle around the resistance level of $17,200, suggesting that the king coin could retreat a little bit, before attempting to break higher again.
On the upside, if the bulls increase the buying pressure, BTC/USD could hit the resistance level of $18,000. However, a daily close above this could lift the price to the resistance levels of $18,500, $20,500, and $22,500. In other words, Bitcoin could retreat and slide towards the lower boundary of the channel, if it breaks below this barrier, the critical supports could be found at $16,000, $14,000, and $12,000 respectively.
BTC/USD Medium-term Trend: Ranging (4H Chart)
According to the 4-hour chart, BTC/USD is trading above the 9-day and 21-day moving averages as the coin moves to cross above the upper boundary of the channel which could touch the resistance level of $17,600 and above. Meanwhile, the Bitcoin price is likely to range-bound around the upper boundary of the channel as buyers may keep the position intact.
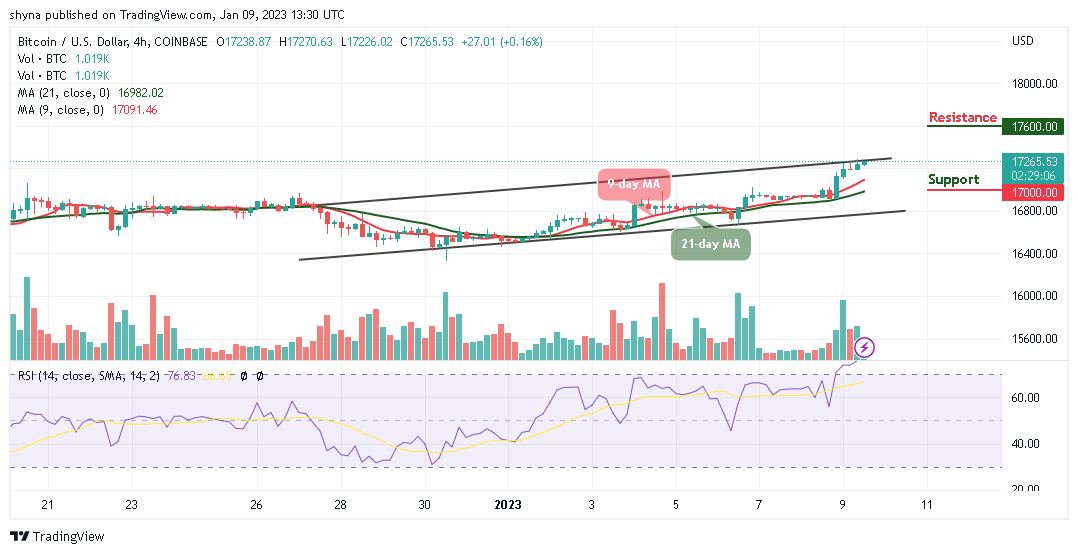
Furthermore, the Relative Strength Index (14) shows that the BTC price may remain on the upside as the signal line stays within the overbought region. On the contrary, if the coin decides to cross below the 9-day and 21-day moving averages; the support level of $17,000 and below may be located.
However, Dash 2 Trade gives you the ability to optimize your trading and speculative profitability with effective crypto trading recommendations, auto trading, and analytics features. There is a D2T token presale ongoing and time is running out. Almost $15 million has been raised so far. You can check the platform beta version here.
Related
- D2T Price Prediction
- How to Buy D2T
Join Our Telegram channel to stay up to date on breaking news coverage