Join Our Telegram channel to stay up to date on breaking news coverage
The Bitcoin price prediction reveals that BTC is yet to gain strength above the channel as the coin shows a few bearish signs.
Bitcoin Prediction Statistics Data:
- Bitcoin price now – $16,750
- Bitcoin market cap – $323 billion
- Bitcoin circulating supply – 19.2 million
- Bitcoin total supply – 19.2 million
- Bitcoin Coinmarketcap ranking – #1
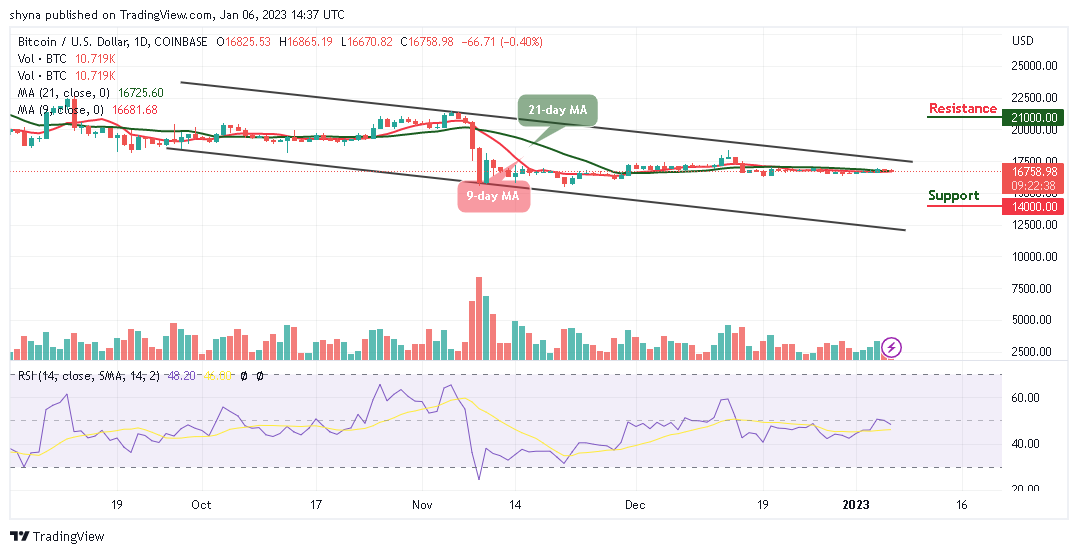
BTC/USD Long-term Trend: Bearish (Daily Chart)
Key levels:
Resistance Levels: $21,000, $23,000, $25,000
Support Levels: $14,000, $12,000, $10,000
Looking at the daily chart, BTC/USD is seen trading within the 9-day and 21-day moving averages. The Bitcoin price could begin another decline if bulls failed to push it toward the upper boundary of the channel. At the opening of today’s trading; the king coin touches the resistance level of $16,865, but any further bearish movement may push it to the bearish zone.
Bitcoin Price Prediction: Would Bitcoin (BTC) Head to Downside?
As the Bitcoin price hovers around the moving averages, moving toward the lower boundary of the channel could begin to show bearish signs below the $16,000 and $15,000 levels. More so, if there are more losses, the price could break the major supports at $14,000, $12,000, and $10,000. Meanwhile, the technical indicator Relative Strength Index (14) moves below the 50-level to increase the bearish movement.
On the other hand, if the king coin crosses above the 9-day and 21-day moving averages; it could begin a bullish movement. Moreover, the main resistance could be located around the $18,000 level and a clear break above this level may push the price toward the resistance levels of $21,000, $23,000, and $25,000.
BTC/USD Medium-term Trend: Ranging (4H Chart)
According to the 4-hour chart, the coin may gain lost momentum if it breaks above the 9-day and 21-day moving averages, but at the moment, the volatility still hovers, and the selling pressure exists, which could lead the coin to the downside. Meanwhile, the $16,500 and below may come into play if BTC breaks below the lower boundary of the channel.
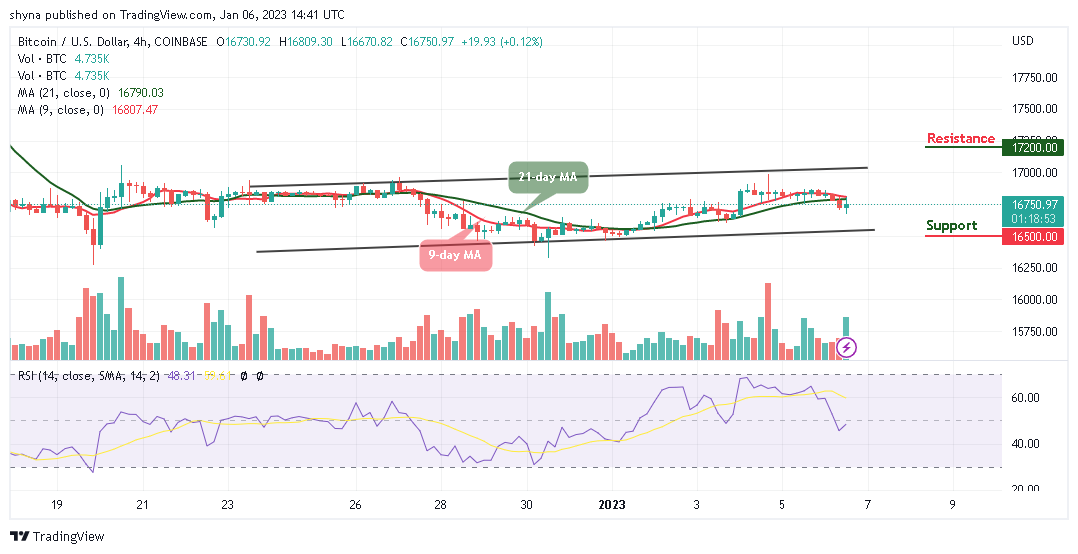
However, if the buyers can reinforce and power the market, traders can expect a retest at a $17,000 resistance level, and breaking this level may further allow the bulls to reach the resistance level of $17,200 and above. The Relative Strength Index (14) is moving to cross above the 50-level, which shows that more bullish signals may play out.
Meanwhile, Dash 2 Trade gives you the ability to optimize your trading and speculative profitability with effective crypto trading recommendations, auto trading, and analytics features. There is a D2T token presale ongoing and time is running out. The presale dashboard launch is coming soon since the product dev is ahead of the schedule. Therefore, almost $12.5 million has been raised so far.
Related
- D2T Price Prediction
- How to Buy D2T
Join Our Telegram channel to stay up to date on breaking news coverage