Join Our Telegram channel to stay up to date on breaking news coverage
The Bitcoin price prediction shows that BTC is likely to cross below the 9-day moving average with the daily low at the $22,000 level.
Bitcoin Prediction Statistics Data:
- Bitcoin price now – $22,602
- Bitcoin market cap – $436.2 billion
- Bitcoin circulating supply – 19.2 million
- Bitcoin total supply – 19.2 million
- Bitcoin Coinmarketcap ranking – #1
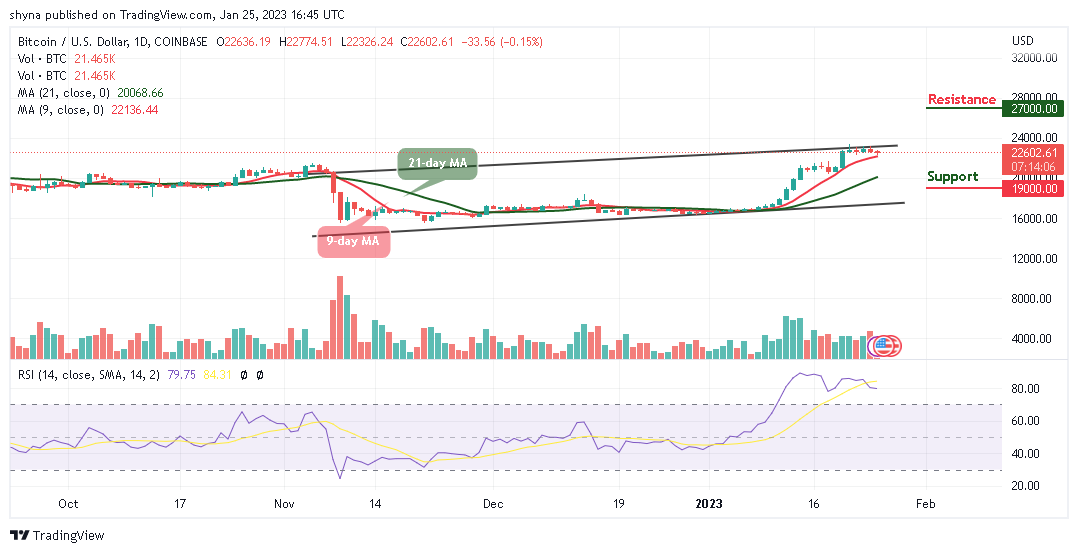
BTC/USD Long-term Trend: Ranging (Daily Chart)
Key levels:
Resistance Levels: $27,000, $29,000, $31,000
Support Levels: $19,000, $17,000, $15,000
BTC/USD is moving sideways above the 9-day and 21-day moving averages as the king coin trades around $22,602. The king coin is likely to resume a downtrend if it crosses below the 9-day moving average. However, until the bulls break above the upper boundary of the channel, the king coin is likely to face a prolonged sideways move or head toward the south.
Bitcoin Price Prediction: Bitcoin (BTC) May Fall to rising Again
At the time of writing, the Bitcoin price is trading up with a loss of 0.15% at its current price of $22,602. However, the current market movement could mark a slight decline, and the coming days may bring the price to the negative side, as it could slide below the 21-day moving average.
Nevertheless, Bitcoin (BTC) remains above the moving averages, with bears bringing the price toward the south, any further bearish movement toward the lower of the channel may bring the price to the support levels of $19,000, $17,000, and $15,000 while the resistance levels could be located at $27,000, $29,000, and $31,000, while the technical indicator Relative Strength Index moves above the 70-level.
BTC/USD Medium-term Trend: Ranging (4H Chart)
The 4-hour chart reveals that the resistance at $23,000 has been too heavy for the bulls to overcome as the price struggles in a consolidation mode, and this has made the cryptocurrency remain on the downside. Meanwhile, as the coin trades below the 9-day and 21-day moving average, crossing below the lower boundary of the channel could hit the support at $21,000 and below.
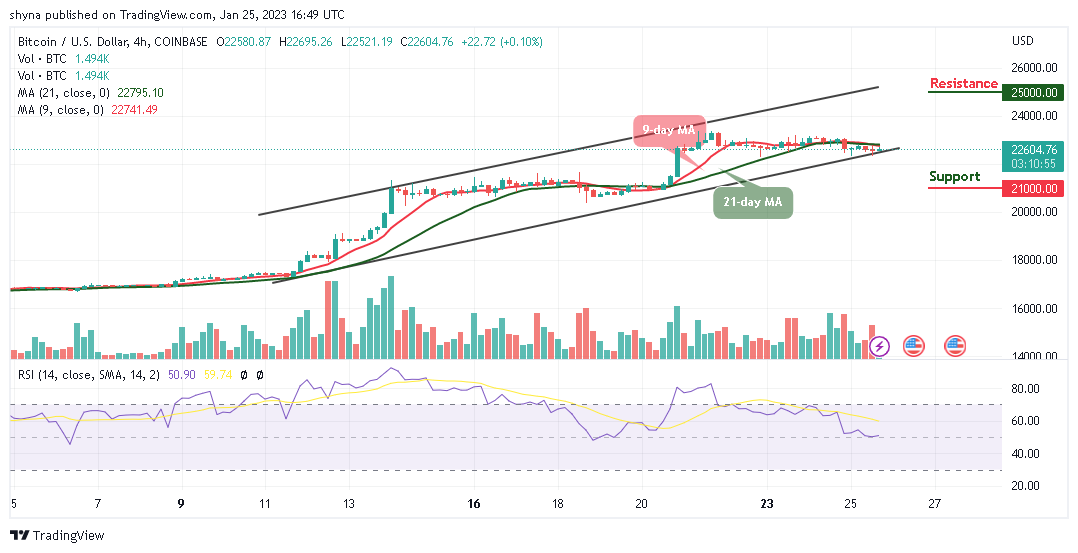
However, the Bitcoin price is roaming around $22,604 as bulls couldn’t push the price above the 9-day and 21-day moving averages. Moreover, the resistance level of $25,000 and above may come into play if the technical indicator Relative Strength Index (14) stays above the 50-level.
Nonetheless, Meta Masters Guild (MEMAG) is the most rapidly growing Play-to-Earn guild of this year. Therefore, it is going to be the biggest mobile gaming guild in Web3. Fun and interesting games, which are compatible with NFTs, are created. And there, community members are rewarded as they speculate and also invest. The MEMAG presale is ongoing and close to $1.5 million has been raised so far.
Related
- Meta Masters Guild – The Fastest Growing Play-to-Earn Guild of 2023
- How to buy MEMAG
Join Our Telegram channel to stay up to date on breaking news coverage