
Join Our Telegram channel to stay up to date on breaking news coverage
The Bitcoin price prediction is currently consolidating and seems to be preparing for the next move above the resistance level of $21,000.
Bitcoin Prediction Statistics Data:
- Bitcoin price now – $20,869
- Bitcoin market cap – $401.8 billion
- Bitcoin circulating supply – 19.2 million
- Bitcoin total supply – 19.2 million
- Bitcoin Coinmarketcap ranking – #1
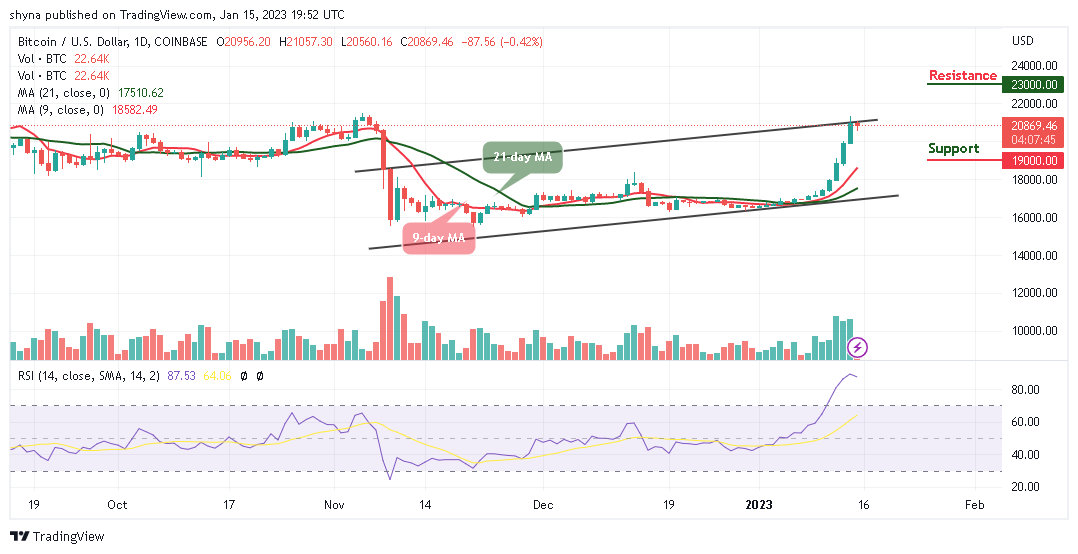
BTC/USD Long-term Trend: Ranging (Daily Chart)
Key levels:
Resistance Levels: $23,000, $25,000, $27,000
Support Levels: $19,000, $17,000, $15,000
BTC/USD is seen hovering at $20,869, with the current consolidation pattern, the king coin stays above the 9-day and 21-day moving averages. Though Bitcoin (BTC) begins the day off intending to trend higher, any further bullish movement toward the upper boundary of the channel could hit the nearest resistance level of $21,000. Meanwhile, any cross below the moving averages could locate the first level of support at $19,500. Beneath this, other supports lie at $19,000, $17,000, and $15,000.
Bitcoin Price Prediction: Bitcoin (BTC) May Break to the Upside
The Bitcoin price is consolidating around the upper boundary of the channel; however, this is looking less as the technical indicator Relative Strength Index (14) moves within the overbought region. On the next positive move, BTC could break above the channel as the candle is still yet to close. Meanwhile, it does look that the bulls may end up closing above this barrier as the potential resistance levels could be found at $23,000, $25,000, and $27,000.
BTC/USD Medium-term Trend: Bearish (4H Chart)
On the 4-hour chart, BTC/USD may need to stay above $21,000 and move towards the upper boundary of the channel to mitigate the short-term bearish pressure so that it can hit the nearest resistance level of $22,000. Nonetheless, this psychological barrier may be closely followed by $23,000 and $25,000 resistance levels.
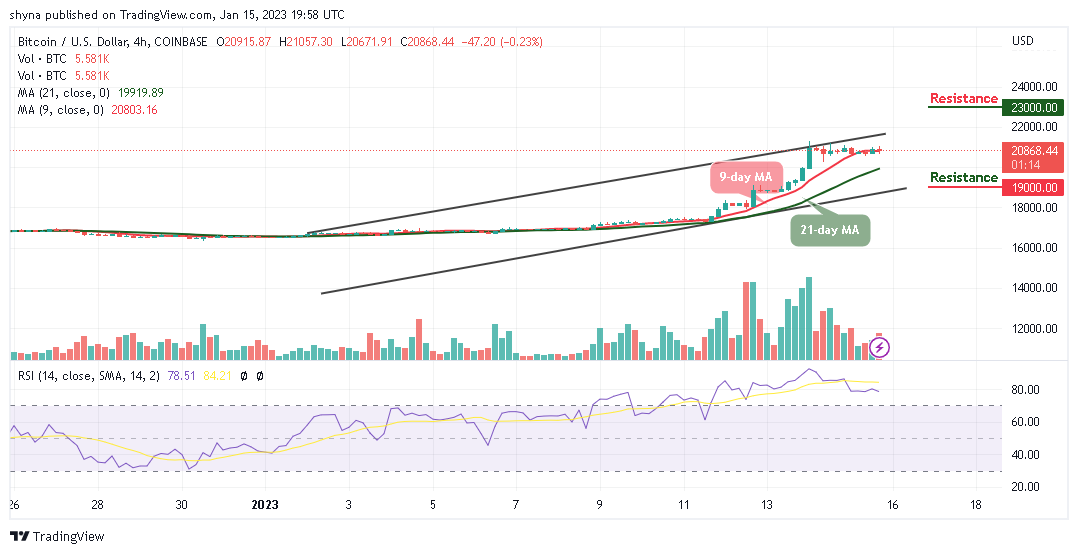
On the contrary, if the king coin heads to the downside, the nearest support may come at $19,500 and a sustainable bearish movement could increase the downside pressure and bring the price toward $19,000 and below. Considering the technical indicator Relative Strength Index (14) on the 4-hour chart, the coin is starting to move in the same direction as traders might expect a sideways movement.
Meanwhile, Meta Masters Guild (MEMAG) is the most rapidly growing Play-to-Earn guild of this year. Therefore, it is going to be the biggest mobile gaming guild in Web3. Fun and interesting games, which are compatible with NFTs, are created. And there, community members are rewarded as they speculate and also invest. The MEMAG presale is ongoing and close to $500,000 has been raised so far.
Related
- Meta Masters Guild – The Fastest Growing Play-to-Earn Guild of 2023
- How to buy MEMAG
Join Our Telegram channel to stay up to date on breaking news coverage