
Join Our Telegram channel to stay up to date on breaking news coverage
The Bitcoin price prediction reveals that BTC is yet to gain strength above the channel as the king coin could risk fresh support.
Bitcoin Prediction Statistics Data:
- Bitcoin price now – $22,987
- Bitcoin market cap – $443.7 billion
- Bitcoin circulating supply – 19.2 million
- Bitcoin total supply – 19.2 million
- Bitcoin Coinmarketcap ranking – #1
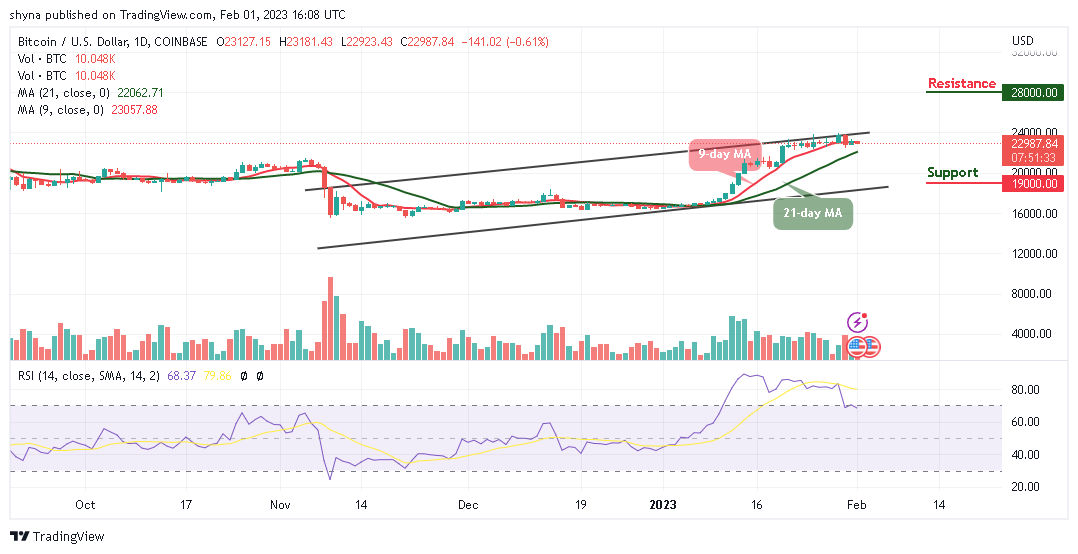
BTC/USD Long-term Trend: Ranging (Daily Chart)
Key levels:
Resistance Levels: $28,000, $30,000, $32,000
Support Levels: $19,000, $17,000, $15,000
Looking at the daily chart, BTC/USD is likely to cross below the 9-day moving average before heading toward the 21-day moving average. The Bitcoin price could begin another decline if bulls failed to push it above the upper boundary of the channel. At the opening of today’s trading; the king coin touches the resistance level of $23,181, but any further bearish movement may push it to the bearish zone.
Bitcoin Price Prediction: Would Bitcoin (BTC) Head to Downside?
As the Bitcoin price moves sideways, sliding toward the lower boundary of the channel could begin to show bearish signs below the $22,500 and $22,000 levels. However, if the market gains more losses, the price could touch the major supports at $19,000, $17,000, and $15,000. Meanwhile, the technical indicator Relative Strength Index (14) moves below the 70-level, suggesting bearish signals in the market.
On the other hand, if the king coin crosses above the upper boundary of the channel; it could begin a bullish movement and the main resistance could be located around the $25,000 level. A clear break above this level could push the price toward the resistance levels of $28,000, $30,000, and $32,000.
BTC/USD Medium-term Trend: Ranging (4H Chart)
According to the 4-hour chart, the coin may gain lost momentum if it breaks above the 9-day and 21-day moving averages, but at the moment, the volatility still hovers, and the selling pressure may come to focus, which could lead the coin to the downside. Meanwhile, the $22,000 and below may be located if BTC breaks below the lower boundary of the channel.
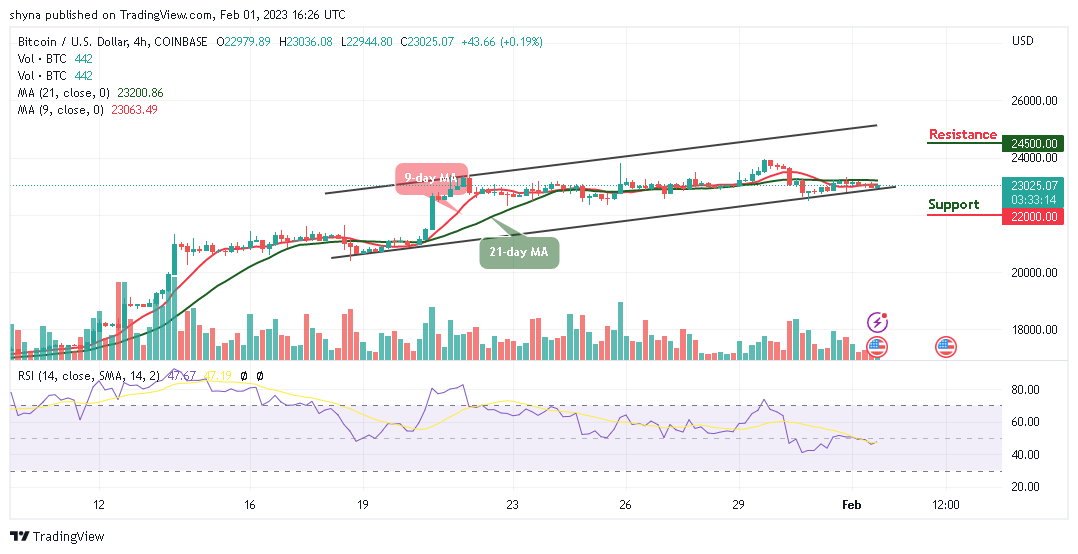
However, if the buyers can reinforce and power the market, traders can expect a retest at a $24,000 resistance level, and breaking this level may further allow the bulls to reach the resistance level of $24,500 and above. The Relative Strength Index (14) is moving below the 50-level, which shows that the market may move sideways.
Bitcoin Alternatives
The Bitcoin price is likely to follow the bearish movement, but the king coin may reclaim the resistance level of $24,000 if the bulls resume back into the market. However, the Meta Masters Guild (MEMAG) is another crypto that benefits traders. This token is this year’s Play-to-Earn guild with the fastest growth. As a result, it will be Web3’s largest mobile gaming guild. It is possible to develop games that are entertaining and intriguing and work with NFTs. And there, community members receive rewards for their investments and speculation. There has already been close to $2.5 million raised during the MEMAG presale.
Join Our Telegram channel to stay up to date on breaking news coverage