Join Our Telegram channel to stay up to date on breaking news coverage
Bitcoin Price Prediction – May 26
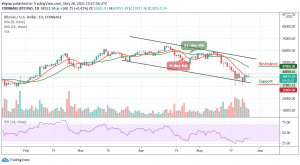
The Bitcoin price has been increasing for a couple of days but was rejected as soon as it reached the $40,855 resistance level.
BTC/USD Long-term Trend: Bearish (Daily Chart)
Key levels:
Resistance Levels: $47,000, $49,000, $51,000
Support Levels: $32,000, $30,000, $28,000
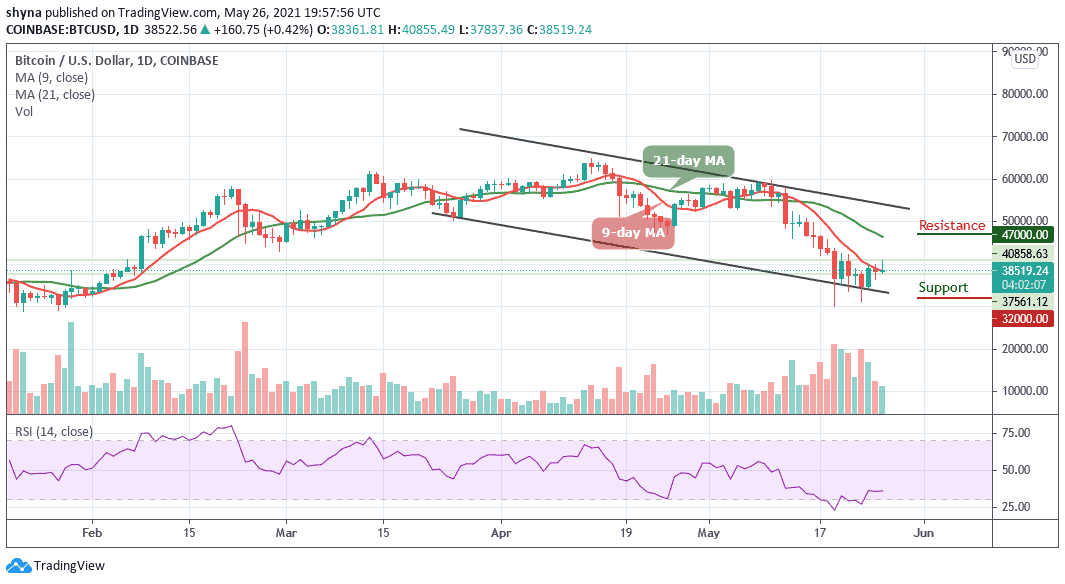
After closing at $38,361 yesterday, BTC/USD gained pace above the $40,500 resistance level today, although the top coin failed to settle above this level, sliding below the 9-day moving average. The Bitcoin price has begun a downside correction and it is currently trading around the $38,519 level. However, if there is a daily close above $40,000, the Bitcoin price might start a steady increase in the coming sessions.
Bitcoin Price Prediction: Will BTC Break above $41,000 Resistance?
Ahead of the bullish movement lies resistance at $42,000, which the coin may reach or surpasses, but the trend could turn lower after testing resistance. Therefore, if the bullish momentum continues, the Bitcoin price may advance to cross the 21-day moving average to reach the resistance levels at $47,200, $49,000, and $51,000.
On the downside, sellers may encounter supports at $32,000, $30,000, and $28,000, should the Bitcoin price cross below the lower boundary of the channel. However, the sideways movement is revealed on the daily chart as the Relative Strength Index (14) keeps moving in the same direction below the 40 level. Meanwhile, if the market price drops, it is likely that the technical indicator will turn more bearish.
BTC/USD Medium – Term Trend: Bearish (4H Chart)
Following the Bitcoin price’s fall from the resistance level of $40,855 a few hours ago, the 9-day and 21-day moving averages have been strong support and resistance levels. If the price crosses above the upper boundary of the channel, BTC/USD may print a new high of around $41,000.
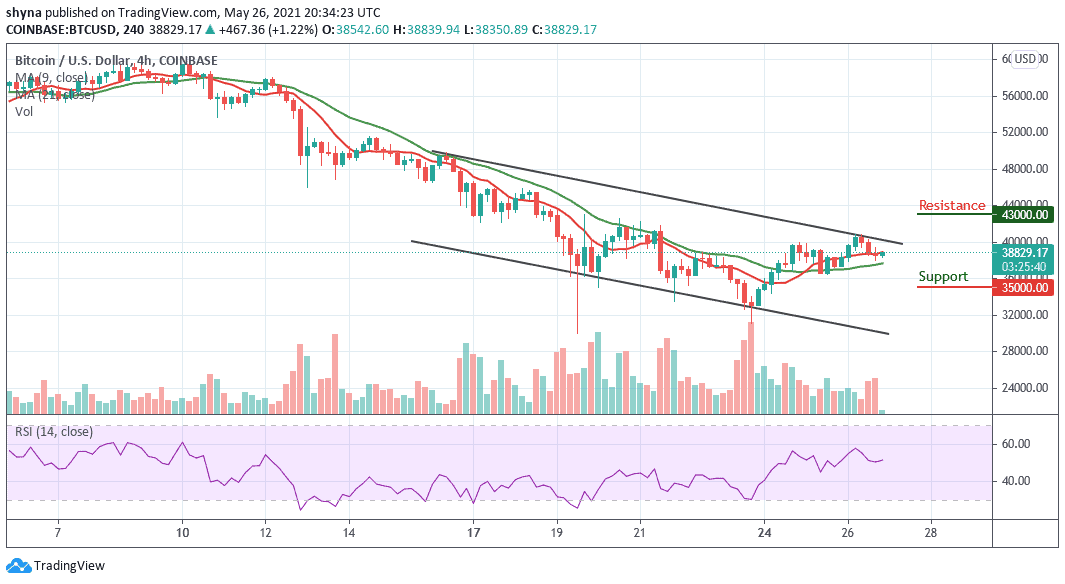
However, with the technical indicator Relative Strength Index (14) currently at the 50 level, any bullish movement above this may likely take the Bitcoin price to the resistance level of $43,000 and above. On the other hand, a break below the 21-day moving average could plunge the Bitcoin price to the support level at $35,000 and below.
Looking to buy or trade Bitcoin (BTC) now? Invest at eToro!
75% of retail investor accounts lose money when trading CFDs with this provider
Join Our Telegram channel to stay up to date on breaking news coverage