Join Our Telegram channel to stay up to date on breaking news coverage
Bitcoin Price Prediction – November 25
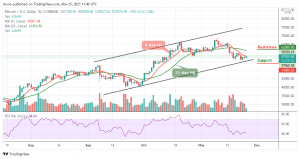
The Bitcoin price restarts the uptrend after crossing above the critical barrier of $58,000 to touch the daily high of $58,500.
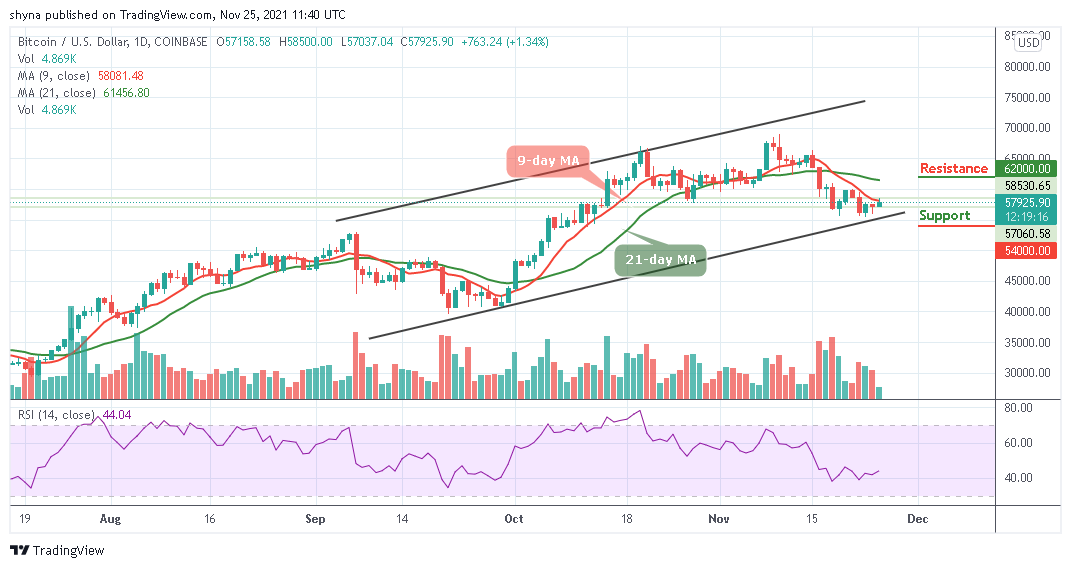
BTC/USD Long-term Trend: Ranging (Daily Chart)
Key levels:
Resistance Levels: $62,000, $64,000, $66,000
Support Levels: $54,000, $52,000, $50,000
BTC/USD looks green today as the price hovers above the resistance level of $58,000 from the low of $57,037. However, a daily close above the resistance level of $58,000 may increase the Bitcoin price to $60,000. At the moment, all eyes focus on the next hurdle above the 9-day moving average. However, traders should note that a consistent price increase would encourage more buyers to join the market if bulls increase their positions.
Bitcoin Price Prediction: Bitcoin (BTC) May Break Higher
At the time of writing, the Bitcoin price is moving marginally at its current price of $57,925.90 with a move towards the 9-day moving average. According to the daily chart, this marks a meaningful climb from the opening price of $57,158 level, therefore, it is important to note that the current movement may cause the coin to break above the 9-day moving average and could also climb above the 21-day moving average as well.
However, if the market decides to fall below the lower boundary of the channel, the Bitcoin price could go lower, and if that barrier fails to hold the sell-off, traders may see a serious decline towards the support levels of $54,000, $52,000, and $50,000. All the same, any further bullish movement above the 9-day and 21-day moving averages may reach the resistance level at $62,000, $64,000, and $66,000 as the Relative Strength Index (14) moves cross above 45-level, suggesting more bullish signals into the market.
BTC/USD Medium – Term Trend: Ranging (4H Chart)
According to the 4-hour chart, the Bitcoin price is hovering above the 9-day and 21-day moving averages. However, intraday trading is still looking bullish as a cross above the upper boundary of the channel could hit the resistance level at $60,000 and above.
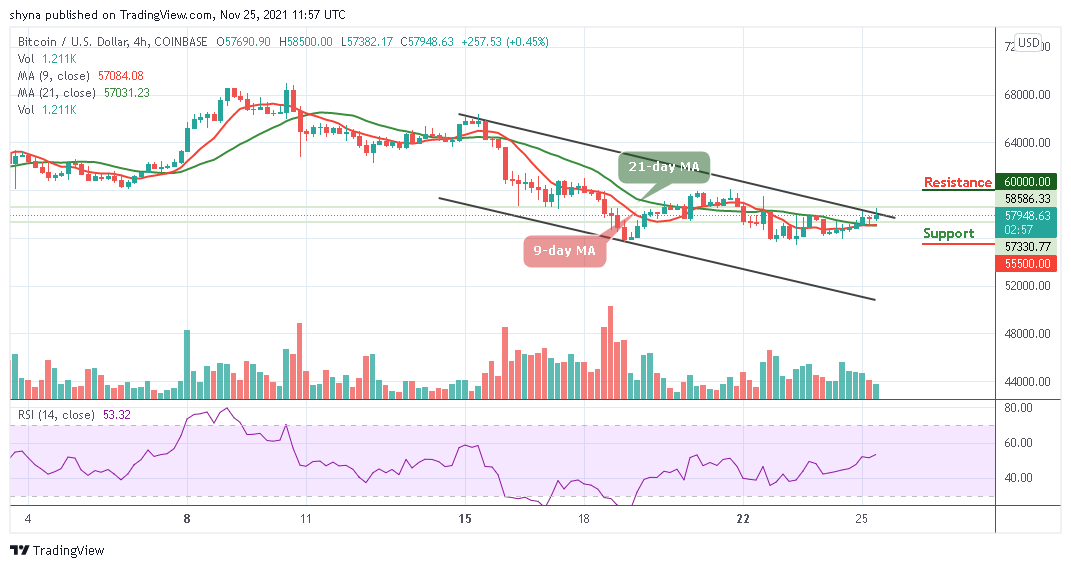
On the contrary, if the buyers failed to keep pushing the market upward, traders can expect a retreat at the $57,000 support level, and breaking this level may further bring the price below the 9-day and 21-day moving averages to reach the support level of $55,500 and below. Meanwhile, the Relative Strength Index (14) is seen moving above 50-level to enter into the positive side.
Looking to buy or trade Bitcoin (BTC) now? Invest at eToro!
68% of retail investor accounts lose money when trading CFDs with this provider
Read more:
- How to buy Bitcoin
- How to buy Cryptocurrency
Join Our Telegram channel to stay up to date on breaking news coverage