Join Our Telegram channel to stay up to date on breaking news coverage
Bitcoin Price Prediction – October 31
The Bitcoin price prediction becomes a sea of red, with nearly all assets suffering in the greater market collapse
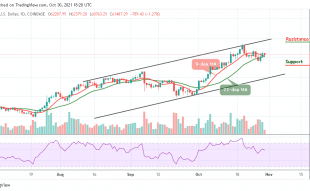
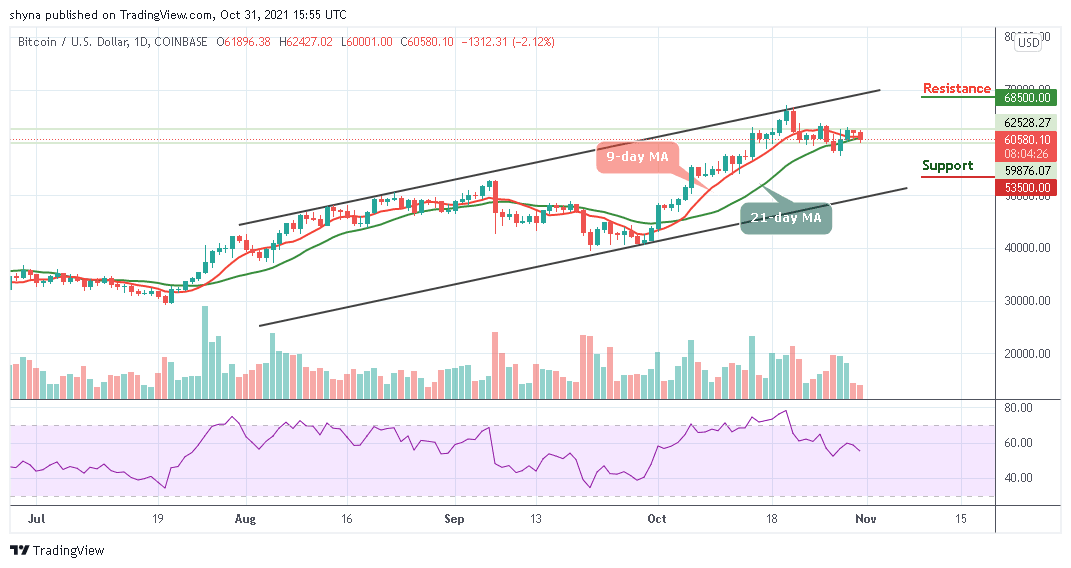
BTC/USD Long-term Trend: Ranging (Daily Chart)
Key levels:
Resistance Levels: $68,500, $70,500, $72,500
Support Levels: $53,500, $51,500, $49,500
BTC/USD has been struggling to maintain its position above $63,000 as the coin nearly dives below the $60,000 level today. The Bitcoin price is in an unstable position as the price slips below the 9-day and 21-day moving averages during the early Asian hours. However, if the breakthrough is confirmed, the downside momentum could gain traction with the next focus on $62,500.
Bitcoin Price Prediction: BTC Price May Visit the Downside
According to the daily chart, the Bitcoin price is trading below the 9-day and 21-day moving averages at $60,580 with a decline of 2.12% on the daily price chart. However, looking at the declining daily volume candles, together with the steady but stable recent Bitcoin price action, traders can assume that a stronger negative move may be coming soon if the red-line of the 9-day MA crosses below the green-line of the 21-day MA. At the moment, the technical indicator, Relative Strength Index (14) is seen moving below 60-level, which could create additional downtrends.
At the time of writing, BTC/USD is struggling to maintain the $60,000 support level. If the coin fails to remain above this level, then, it could drop to the next support levels of $53,500, $51,500, and $49,500. From above, maintaining the $61,000 level could send the coin to retest old support turned resistance levels at $62,500. The further movement could go above the significant 9-day and 21-day moving averages, which could send the price towards the resistance levels of $68,500, $70,500, and $72,500.
BTC/USD Medium – Term Trend: Bearish (4H Chart)
Looking at the 4-hour chart, the bulls are trying to defend the $60,000 support. Meanwhile, the $58,000 and below may come into play if BTC breaks below the current value and move towards the lower boundary of the channel.
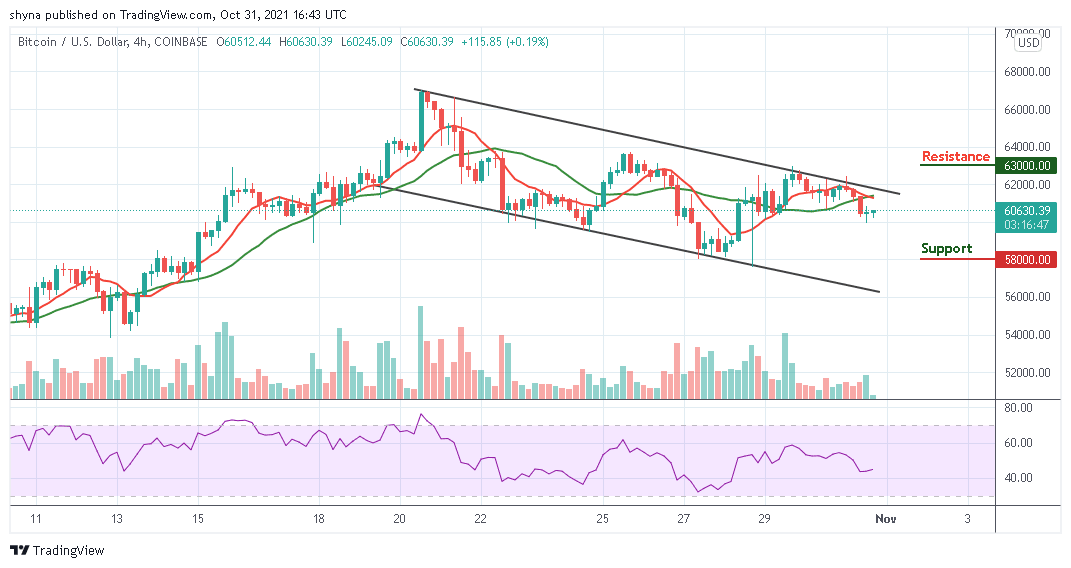
However, if the buyers can regain and push the market price above the 9-day and 21-day moving averages, traders may expect a retest at the $62,000 resistance level, and breaking this level may further allow the bulls to reach the resistance level of $63,000 and above. However, the technical indicator Relative Strength Index (14) is likely to cross below 40-level, indicating additional bearish movement in the market.
Looking to buy or trade Bitcoin (BTC) now? Invest at eToro!
68% of retail investor accounts lose money when trading CFDs with this provider
Read more:
- How to buy Bitcoin
- How to buy Cryptocurrency
Join Our Telegram channel to stay up to date on breaking news coverage