Join Our Telegram channel to stay up to date on breaking news coverage
Bitcoin Price Prediction – March 3
The Bitcoin price prediction sees a 3.44% decline over the past few hours as the cryptocurrency fails to $42,256 and heads lower.
BTC/USD Long-term Trend: Bearish (Daily Chart)
Key levels:
Resistance Levels: $48,000, $50,000, $52,000
Support Levels: $38,000, $36,000, $34,000
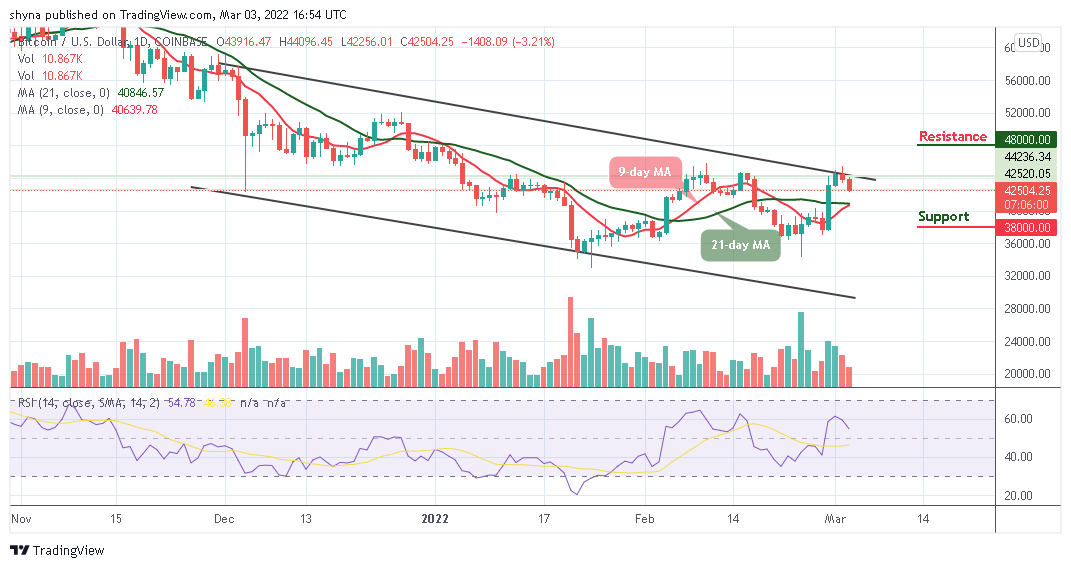
BTC/USD loses its momentum after touching key resistance above $44,096. As of writing, the pair is down 3.44% on the day at $42,256 facing the 9-day and 21-day moving averages. Meanwhile, Bitcoin may struggle to close above $43,000 and if it does, it should be free to rise well above $45,000 if it moves in the next positive direction.
Bitcoin Price Prediction: Can Bitcoin Price Trade Above $45,000?
After a slightly positive move above $44,000, the Bitcoin price is sliding towards the 9-day and 21-day moving averages. Over the past few days, the king coin is now struggling to break above the upper boundary of the channel. Moreover, in today’s session, the coin attempted to push higher above the channel, but the sellers step in and start pushing the coin lower to touch the daily low of $42,256.
Moreover, if the coin moves lower, the $40,000 may serve as the nearest support level, which may likely make room for the coin to fall further to hit the supports at $38,000, $36,000, and $34,000. The Relative Strength Index (14) nosedives below 60-level indicate a downward movement. On the contrary, BTC/USD may likely see the resistance levels of $48,000, $50,000, and $52,000 if it finds its way above the upper boundary of the channel.
BTC/USD Medium-Term Trend: Ranging (4H Chart)
On the 4-Hour chart, the BTC price hovers around $42,470 and could take time to cross above the 9-day and 21-day moving averages. More so, if the bulls gather enough strength, the upward movement may be able to near the resistance levels $46,000 and above.
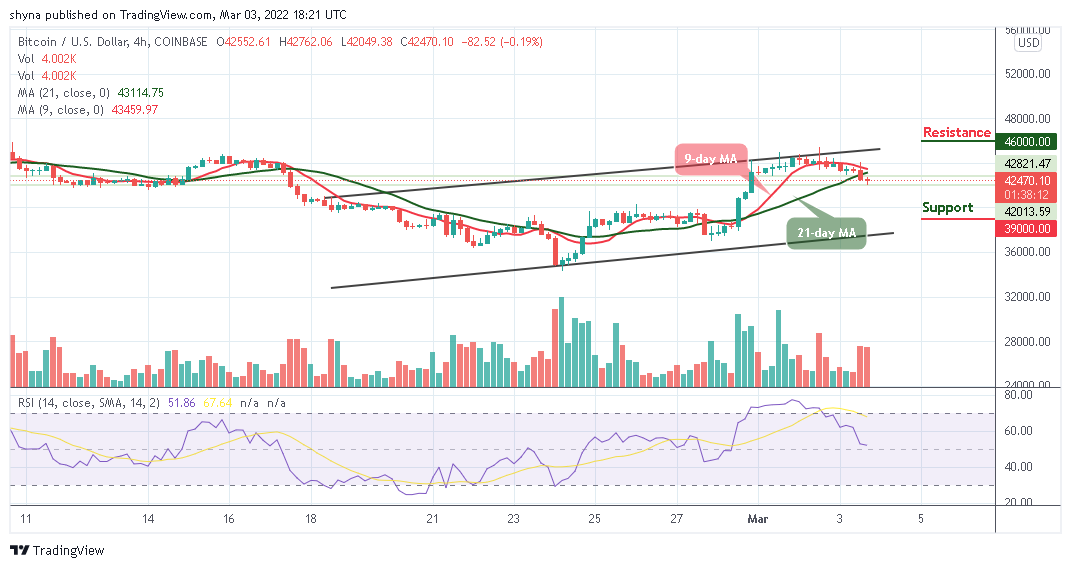
On the downside, immediate support could be located around the $40,000 level while the critical support is at the $39,000 and below. Therefore, the Bitcoin price may likely fall towards the lower boundary of the channel if the bears put more pressure on the market, More so, the Relative Strength Index (14) moves to cross below 40-level, suggesting a bearish movement.
Looking to buy or trade Bitcoin (BTC) now? Invest at eToro!
68% of retail investor accounts lose money when trading CFDs with this provider
Read more:
- How to buy Bitcoin
- How to buy Cryptocurrency
Join Our Telegram channel to stay up to date on breaking news coverage